UI Features
This guide walks through all the features available in the KAOS UI dashboard.
Dashboard Home
The home dashboard provides an overview of all resources in your selected namespace.
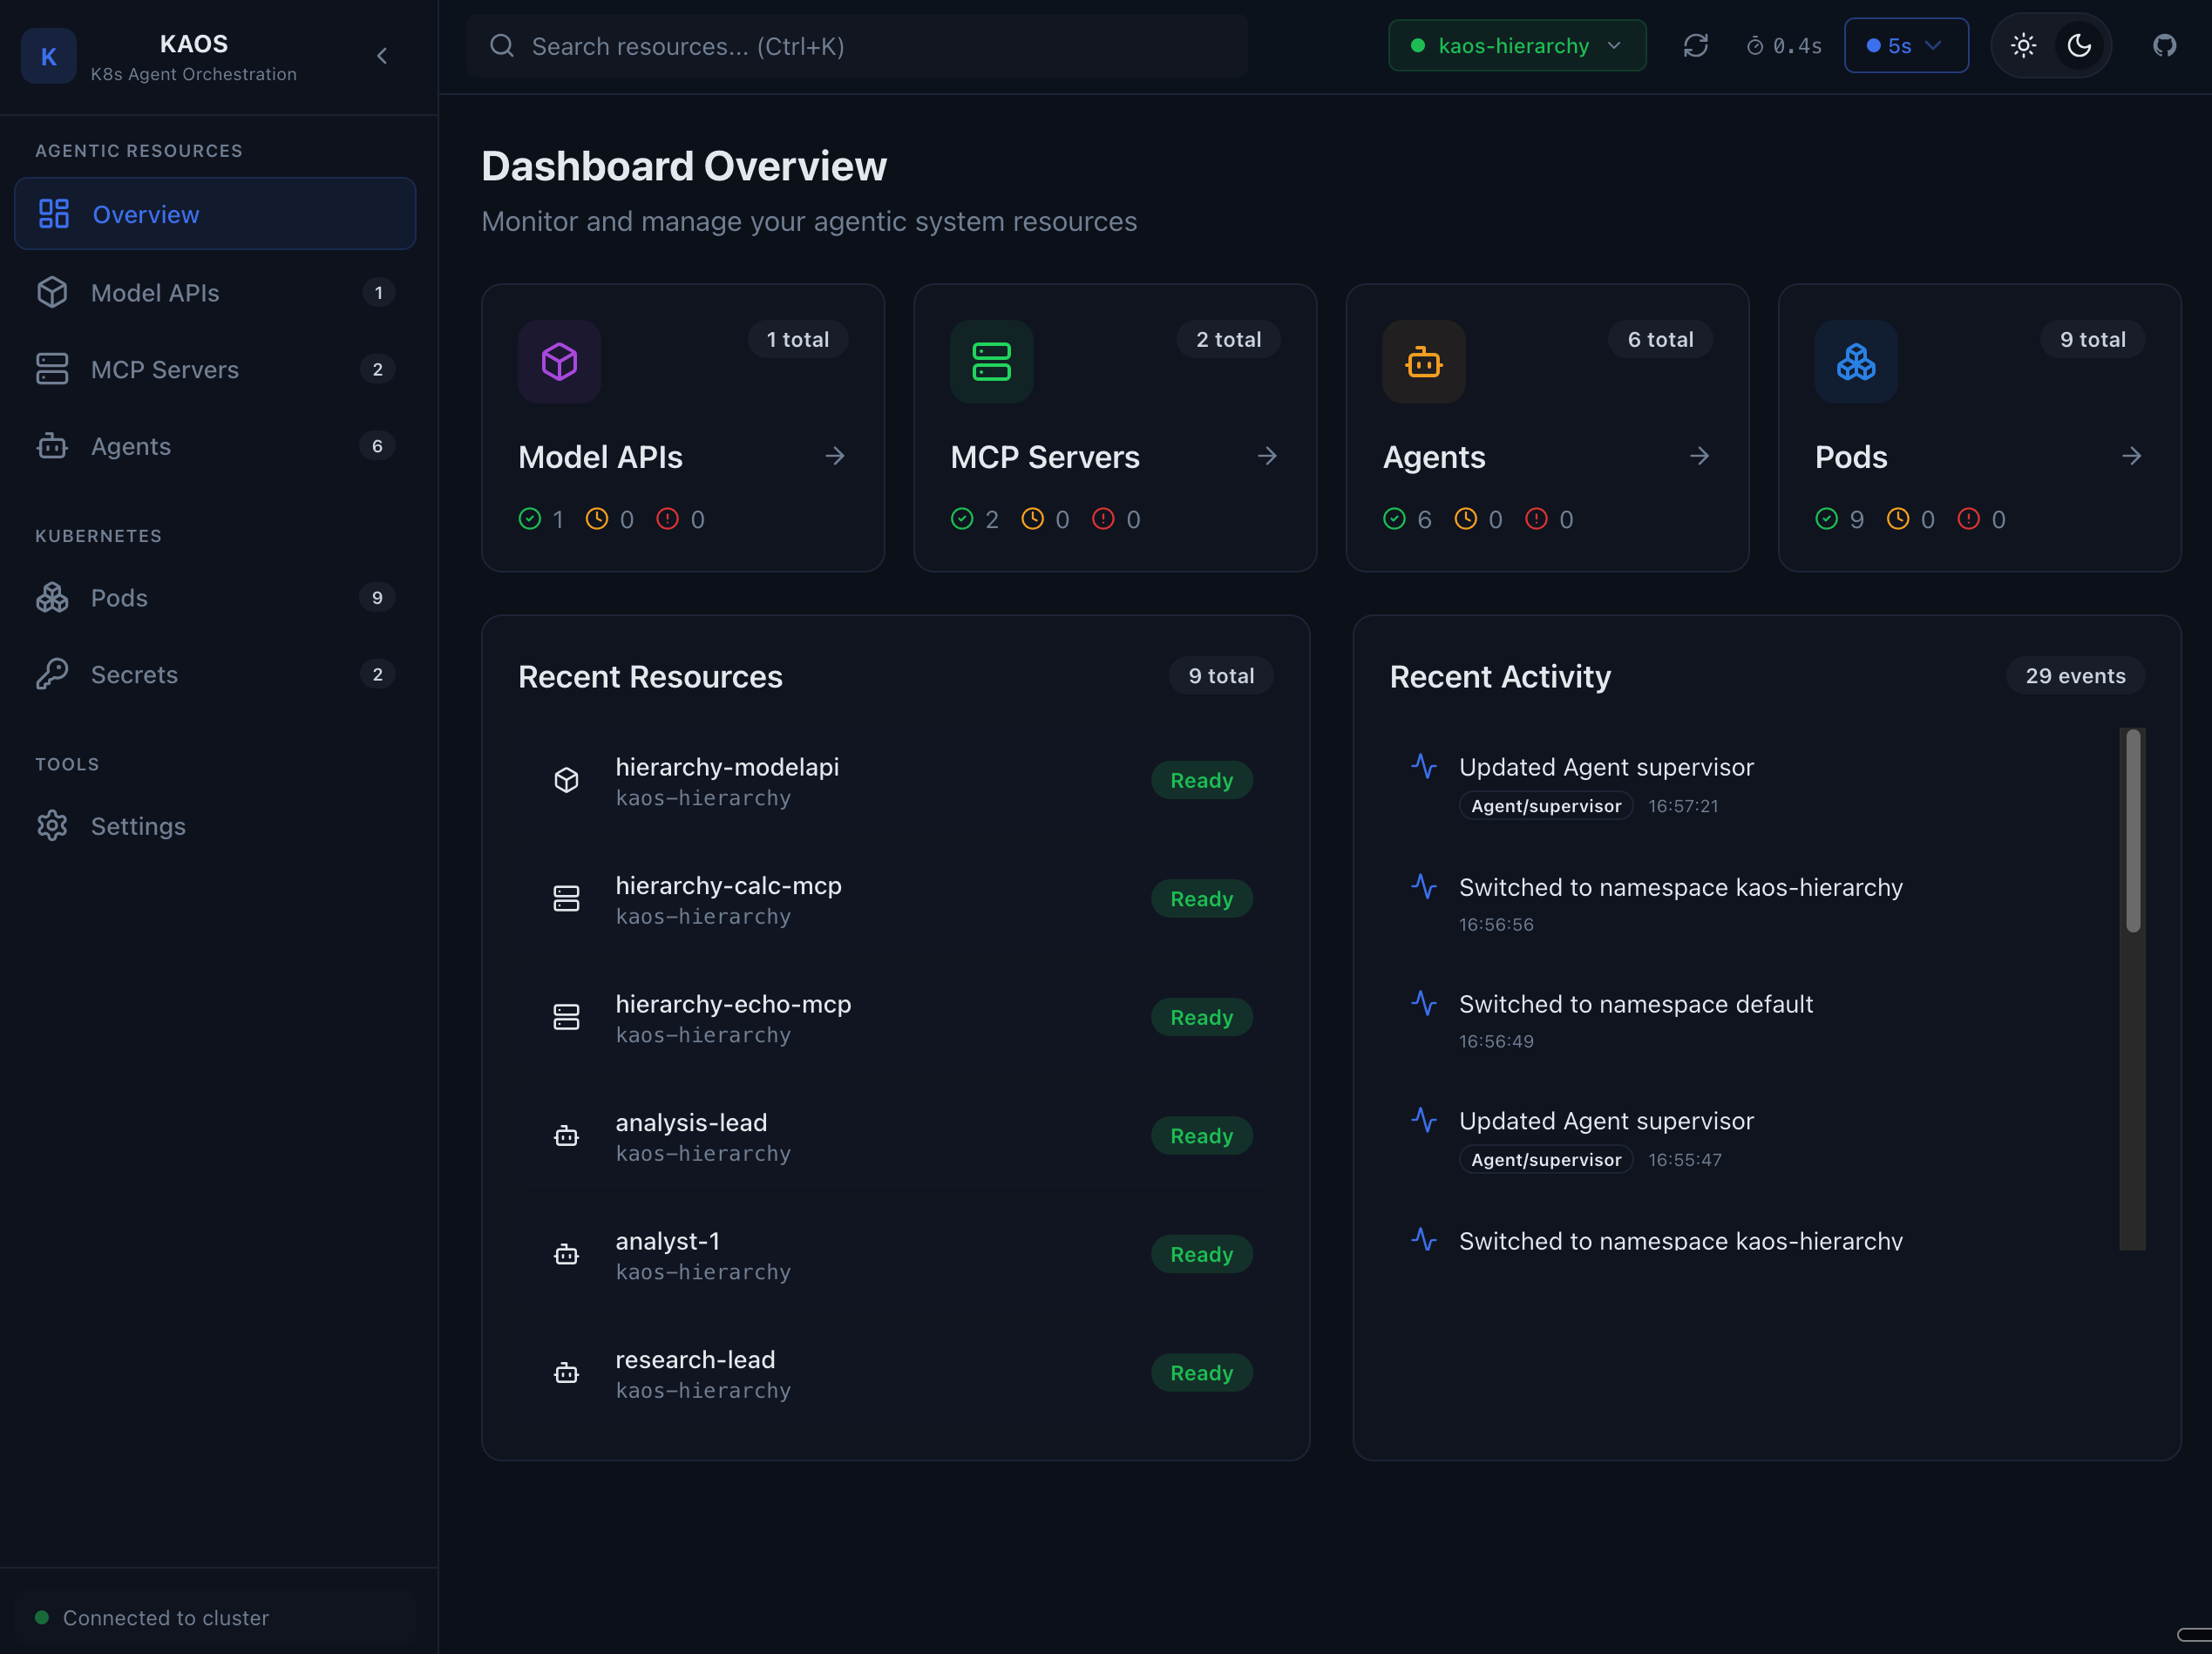
The home page shows:
- Quick statistics for agents, MCP servers, and model APIs
- Resource health status
- Recent activity
Agents
Agent List
View all agents deployed in your namespace.
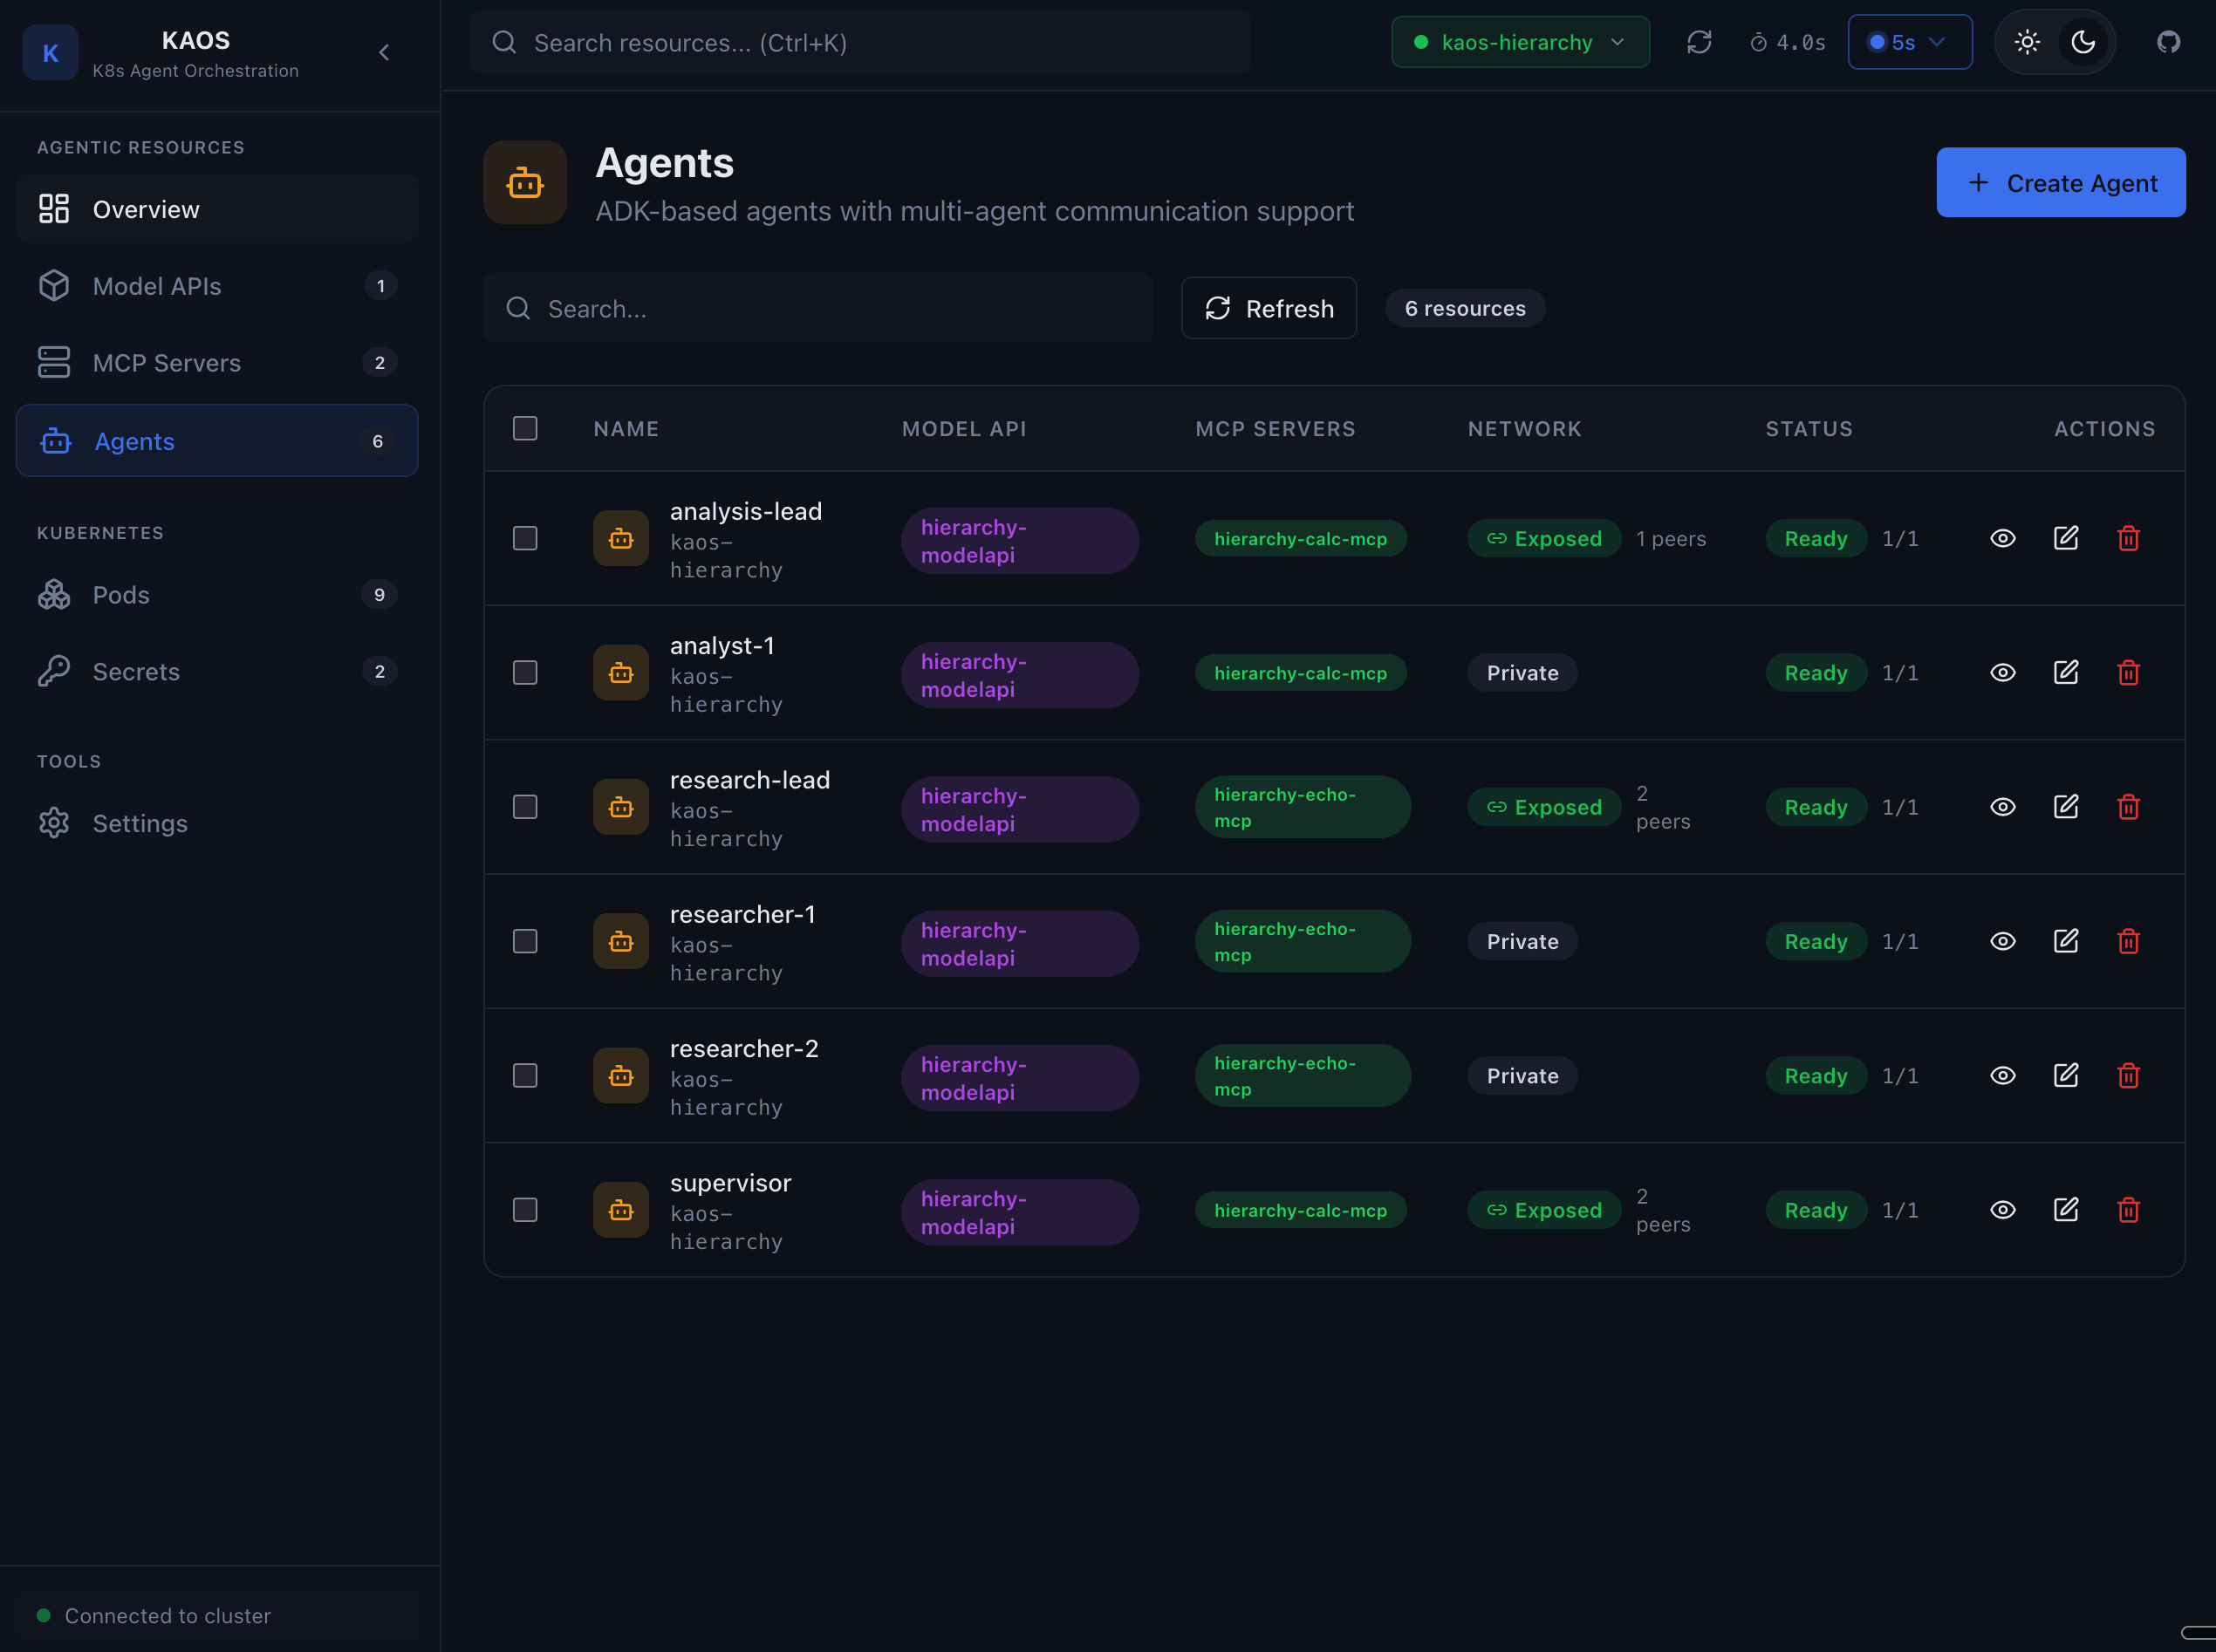
The agent list shows:
- Agent name and status
- Connected model API
- MCP servers attached
- Pod health indicators
Agent Overview
Click on an agent to see detailed information.
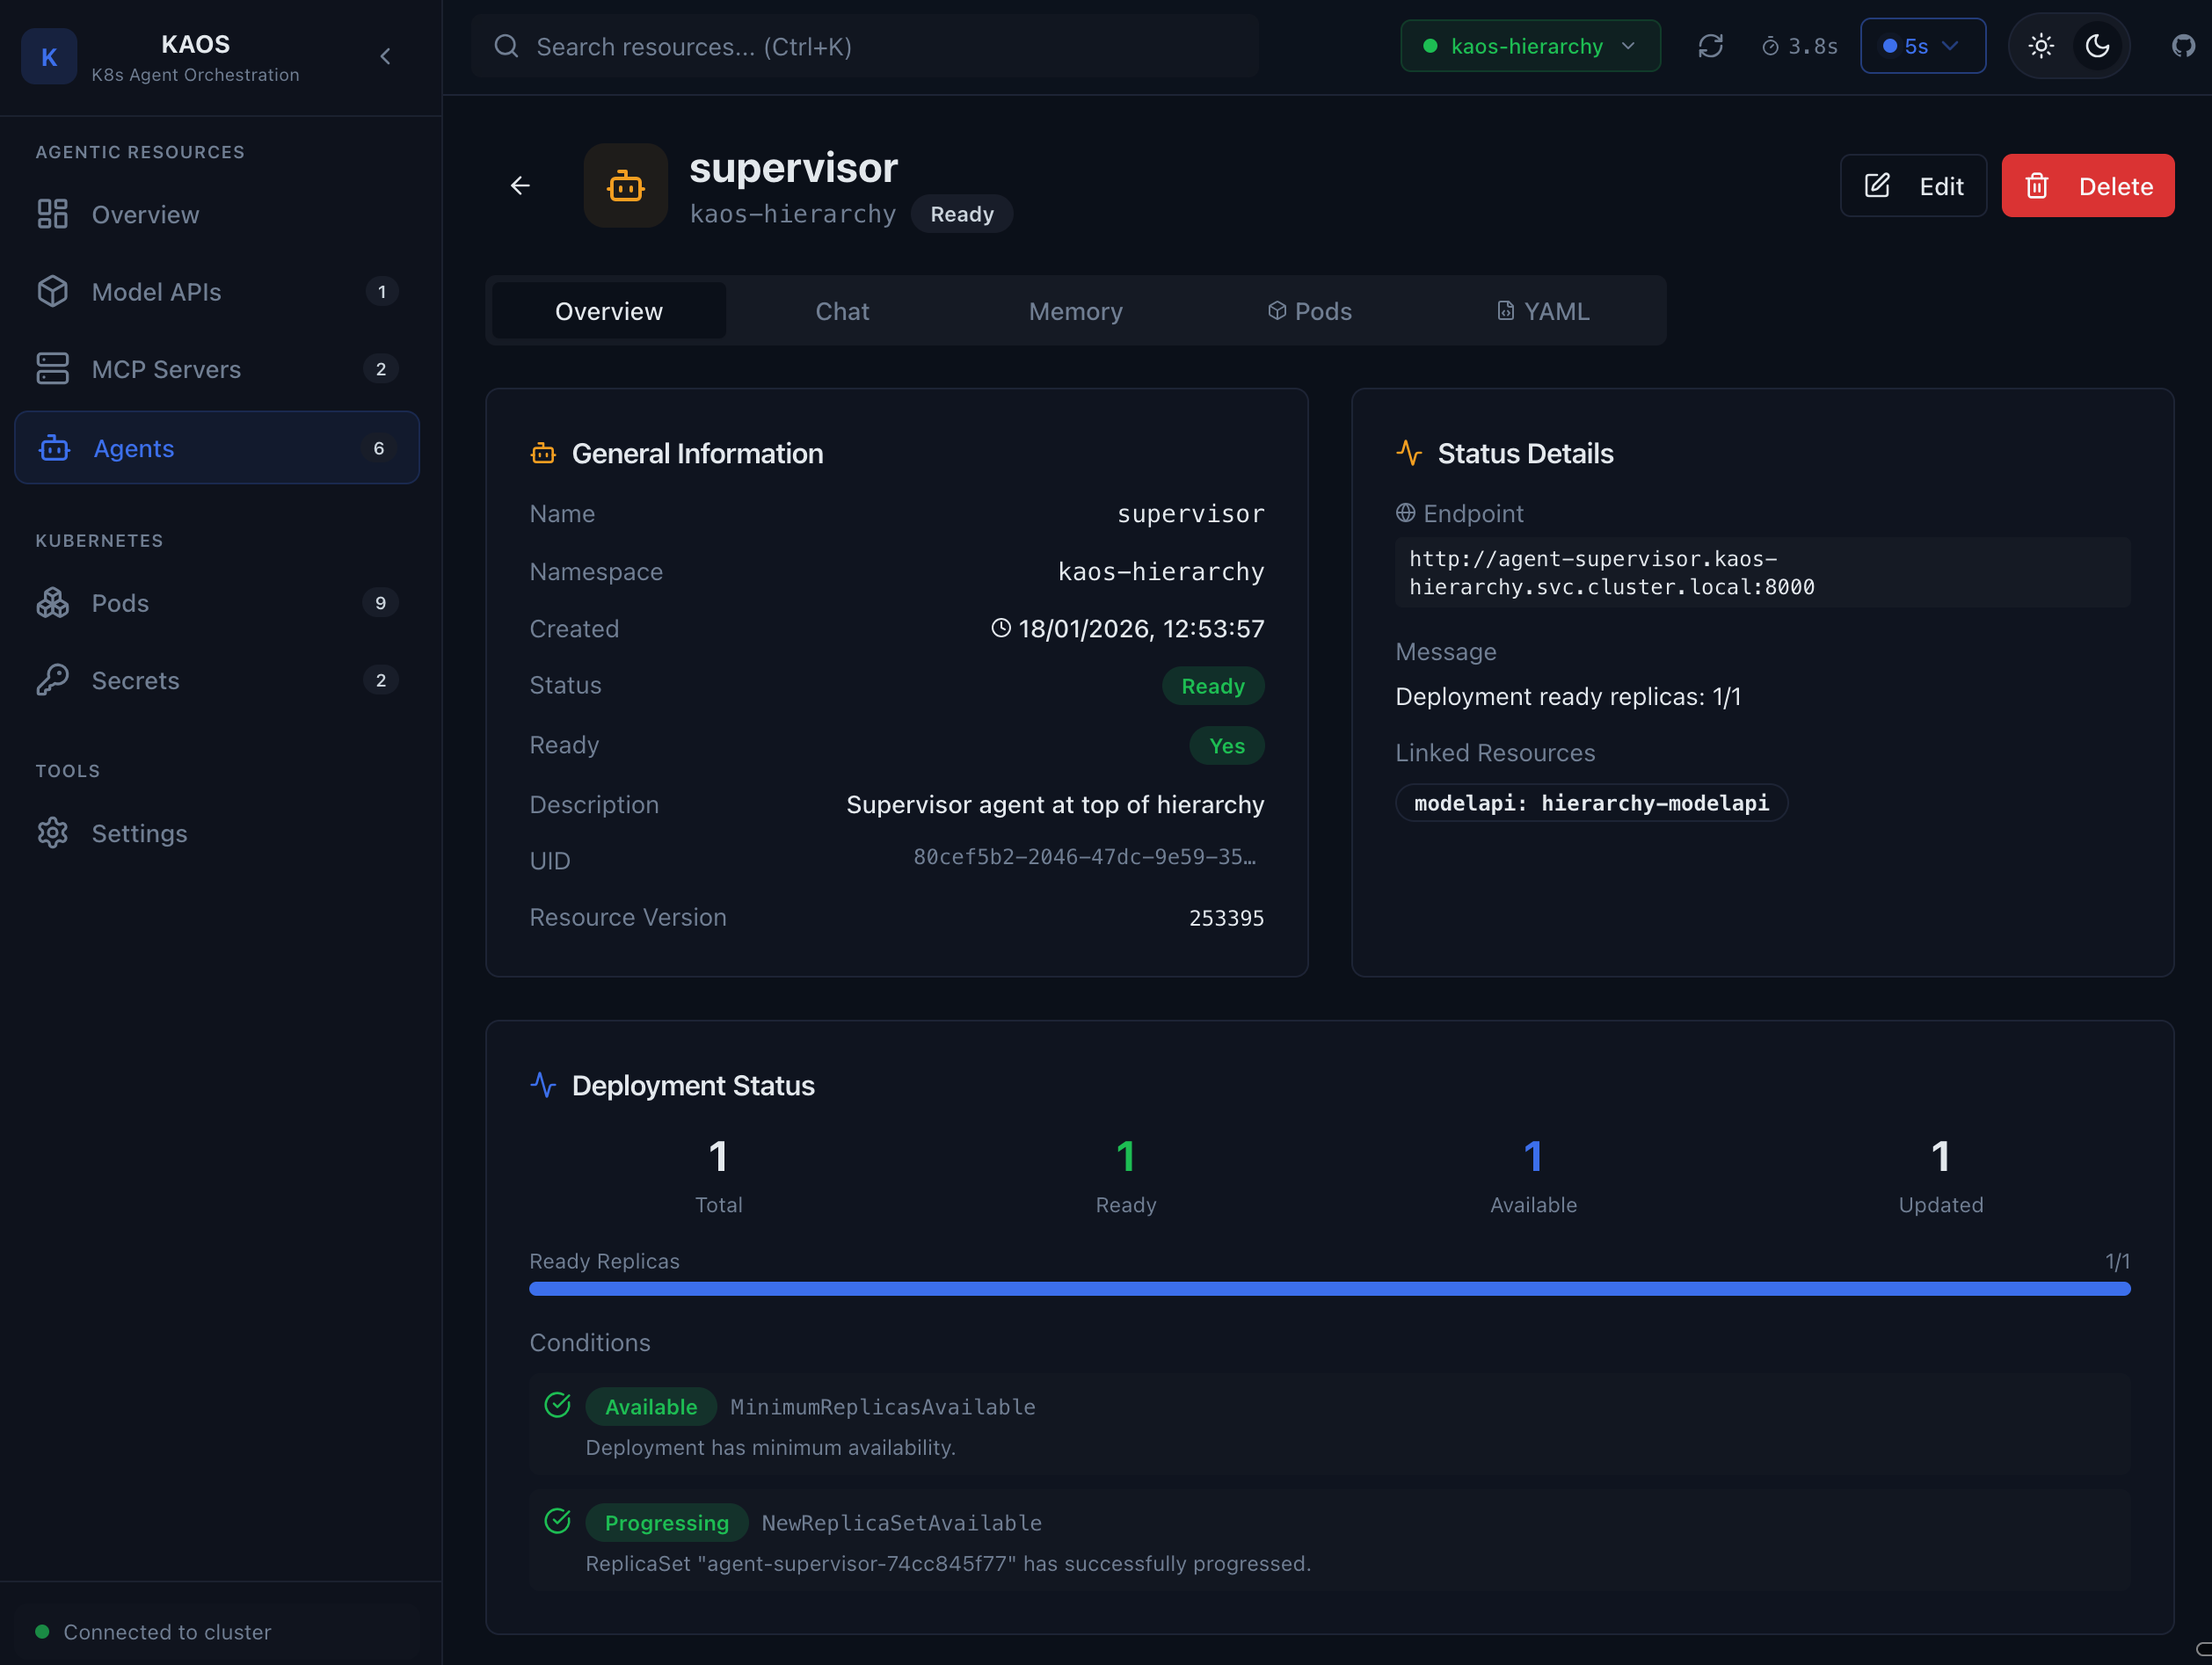
The overview tab displays:
- Agent configuration (instructions, description)
- Model API connection status
- MCP server connections
- Agent network (peer agents)
- Deployment status
Agent Chat
Test your agent directly from the UI with the built-in chat interface.
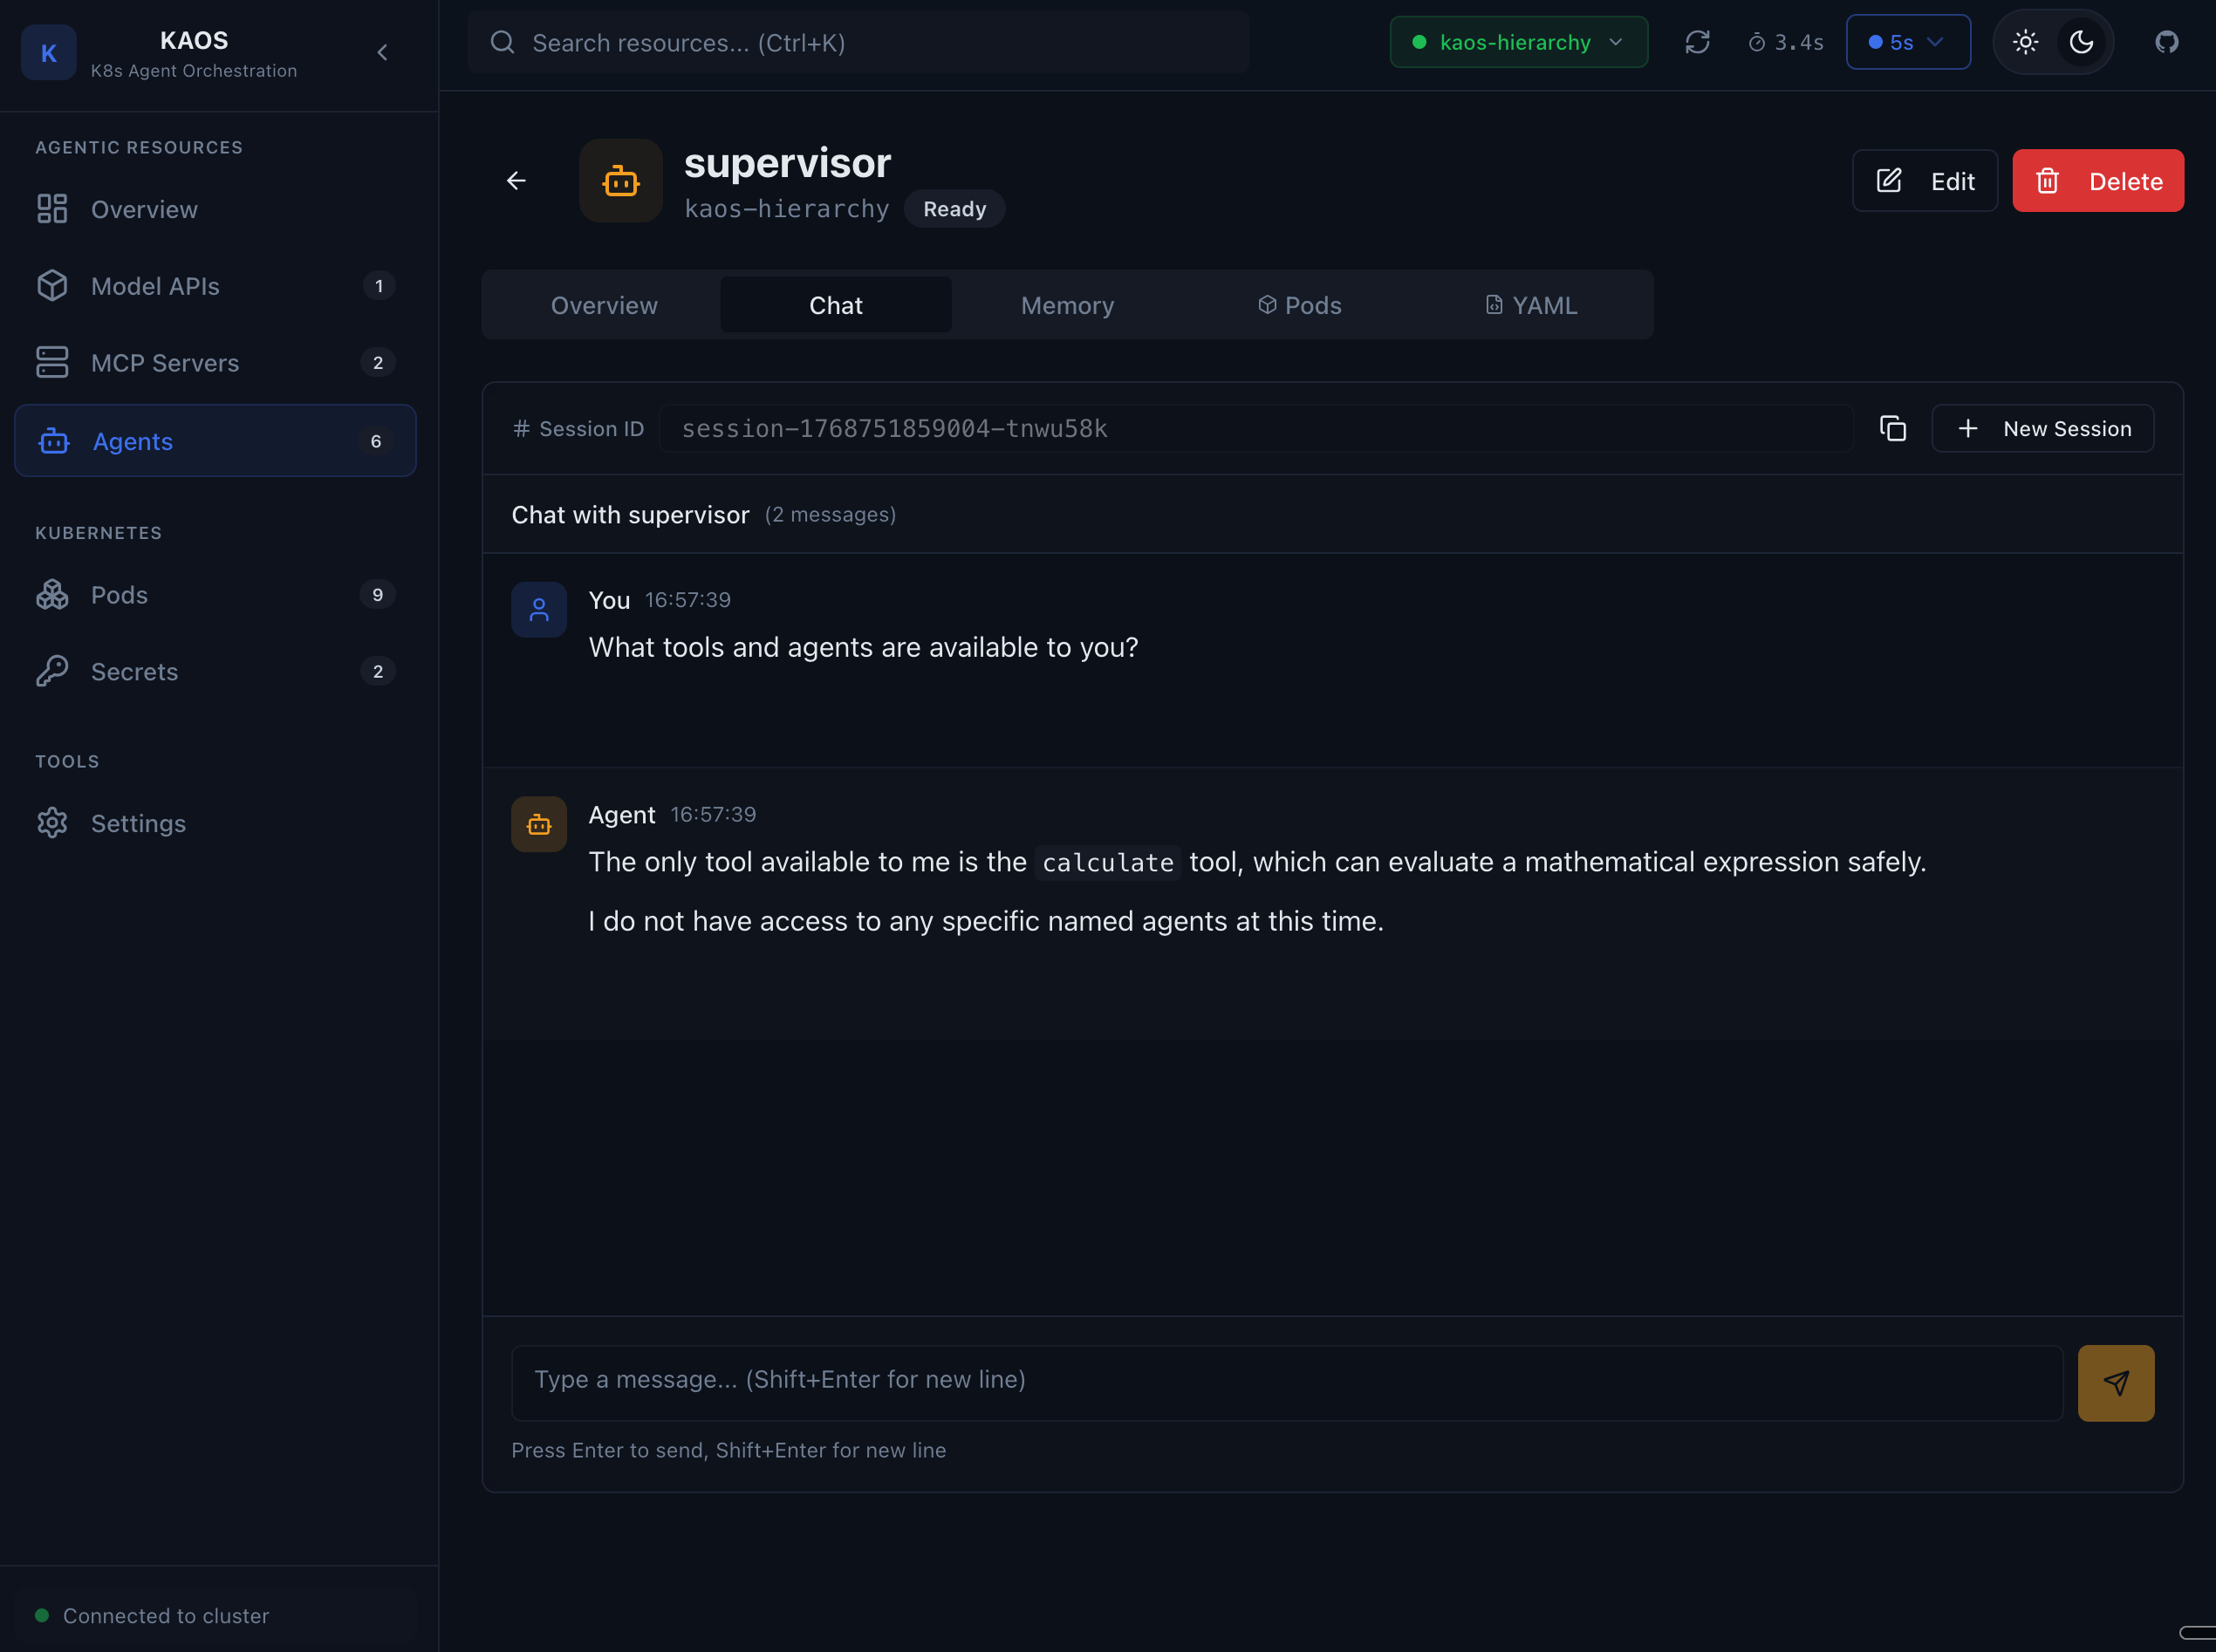
Features:
- Real-time chat with your agent
- View agent responses
- Test tool calling behavior
- Debug delegation to sub-agents
Agent Memory
Inspect the agent's memory and conversation history.
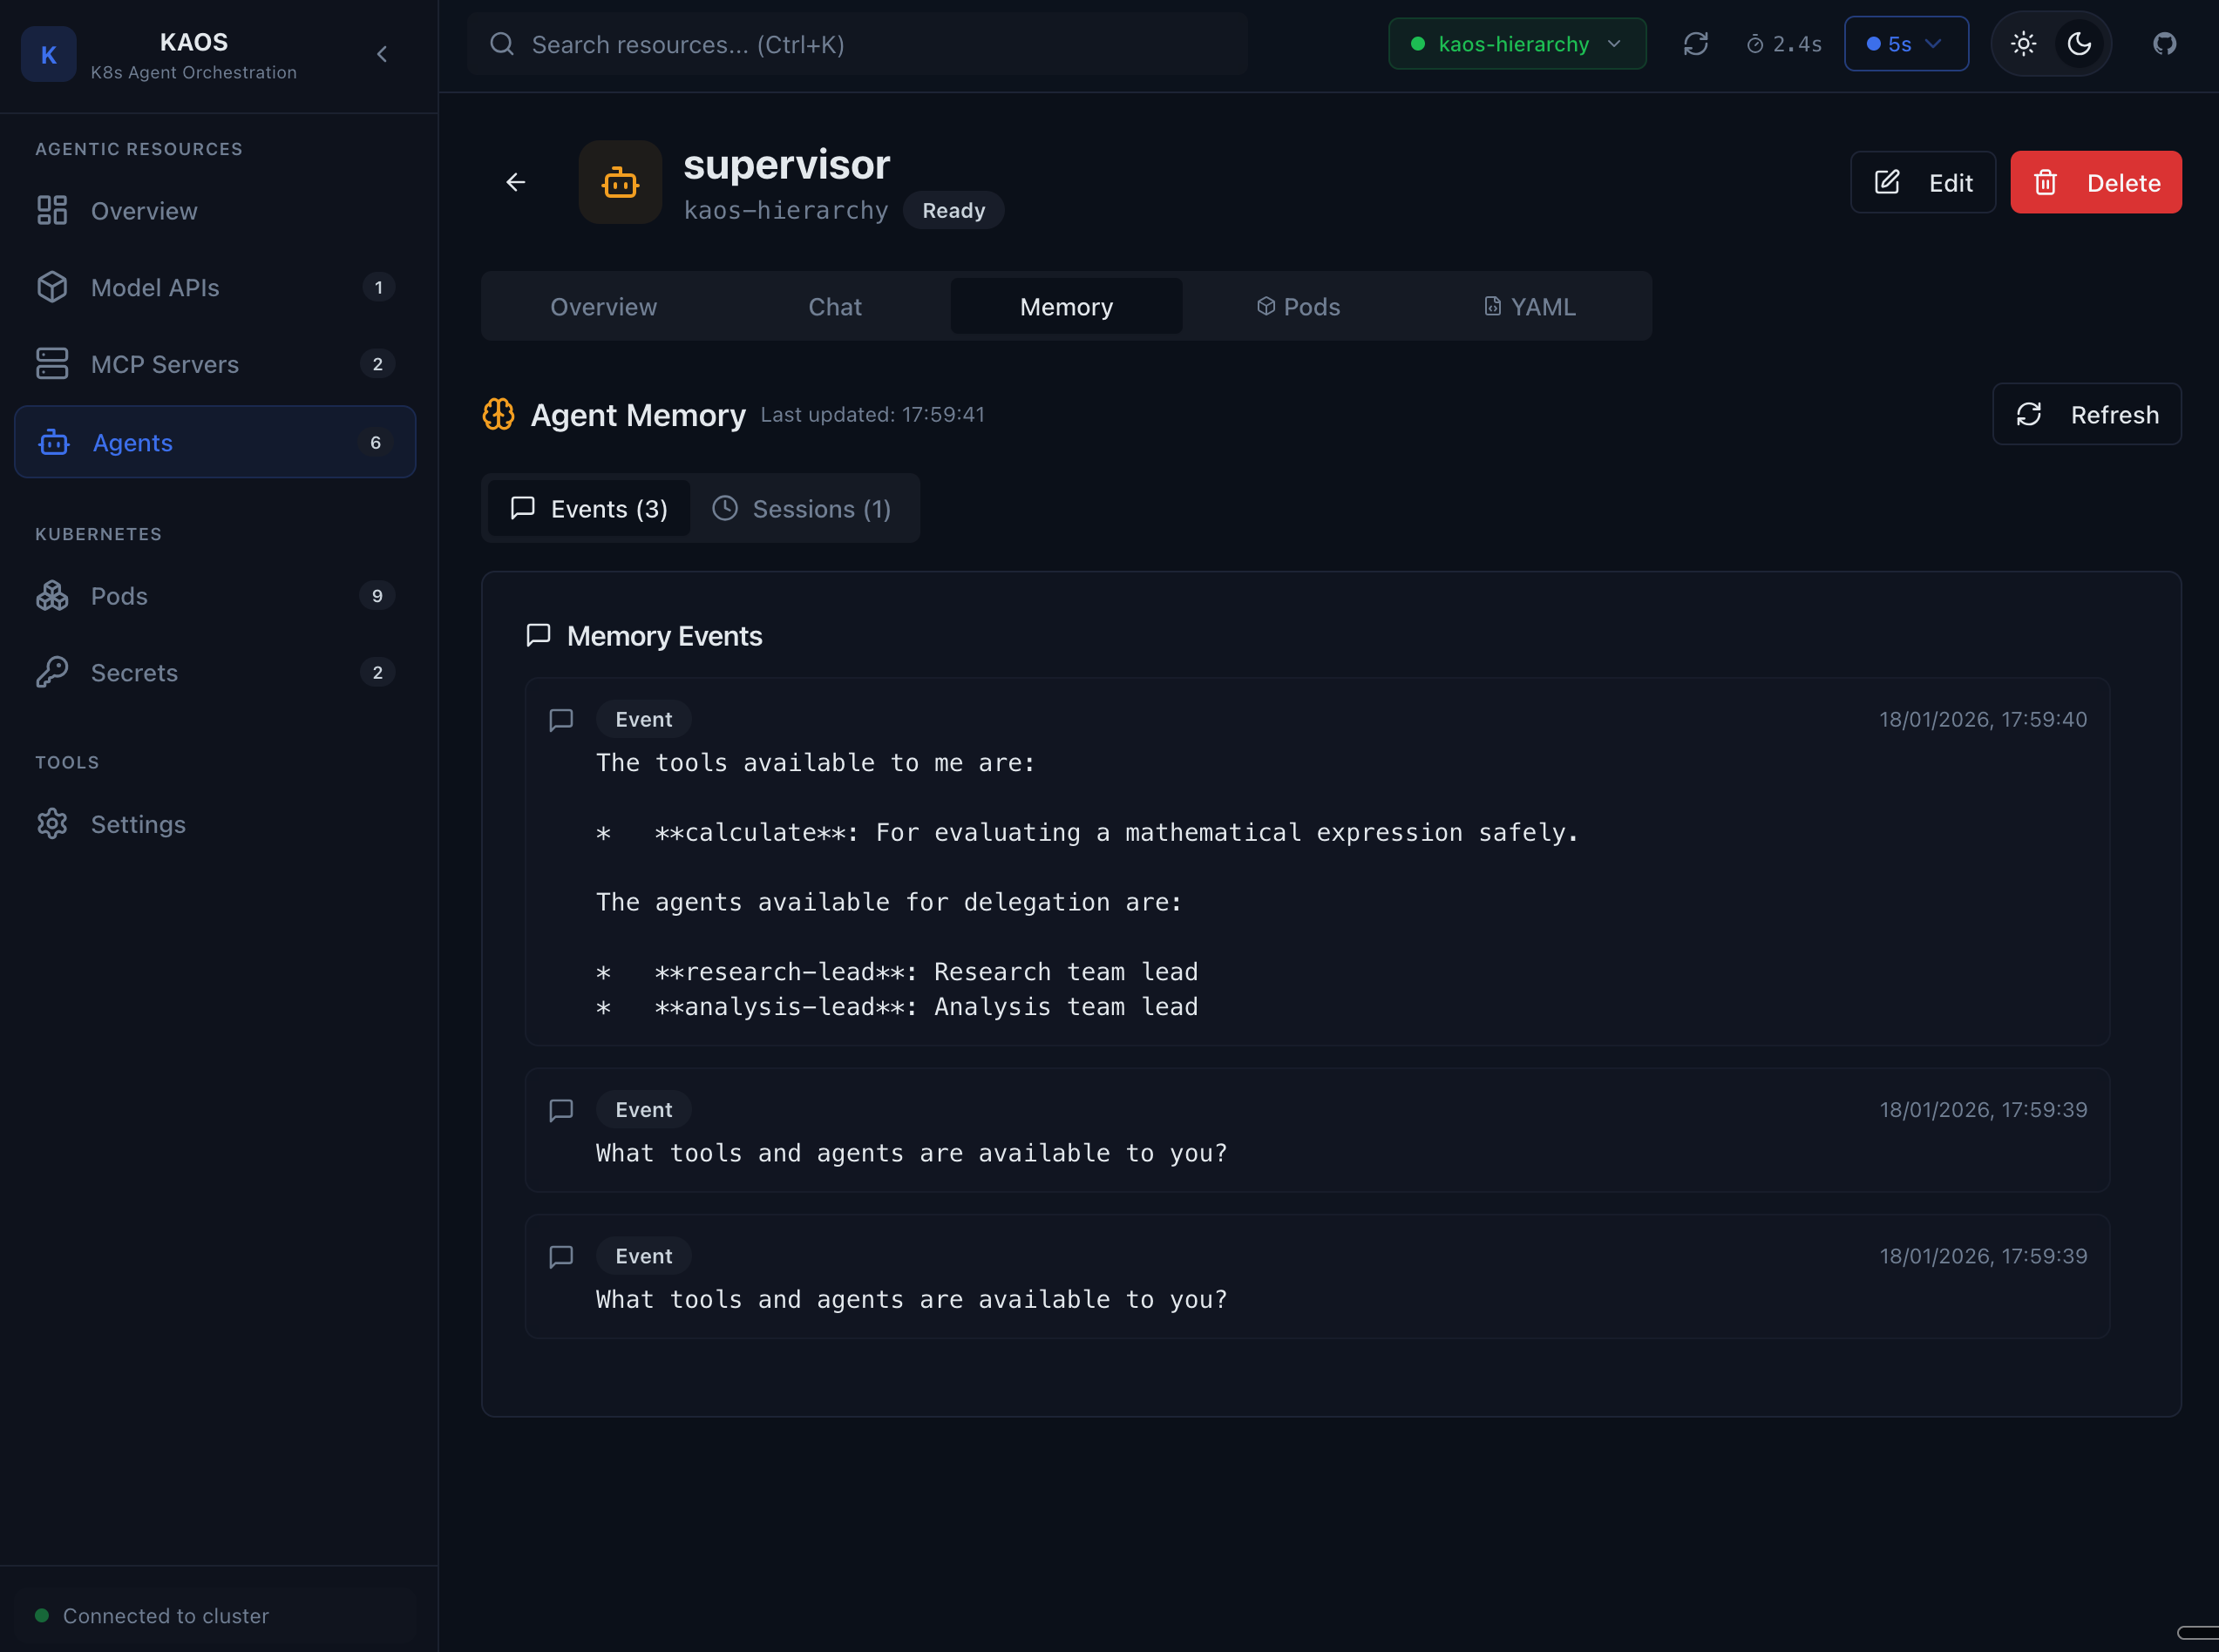
The memory tab shows:
- Session history
- Event log (user messages, agent responses, tool calls)
- Memory state for debugging
Agent Pods
View the pods running your agent.
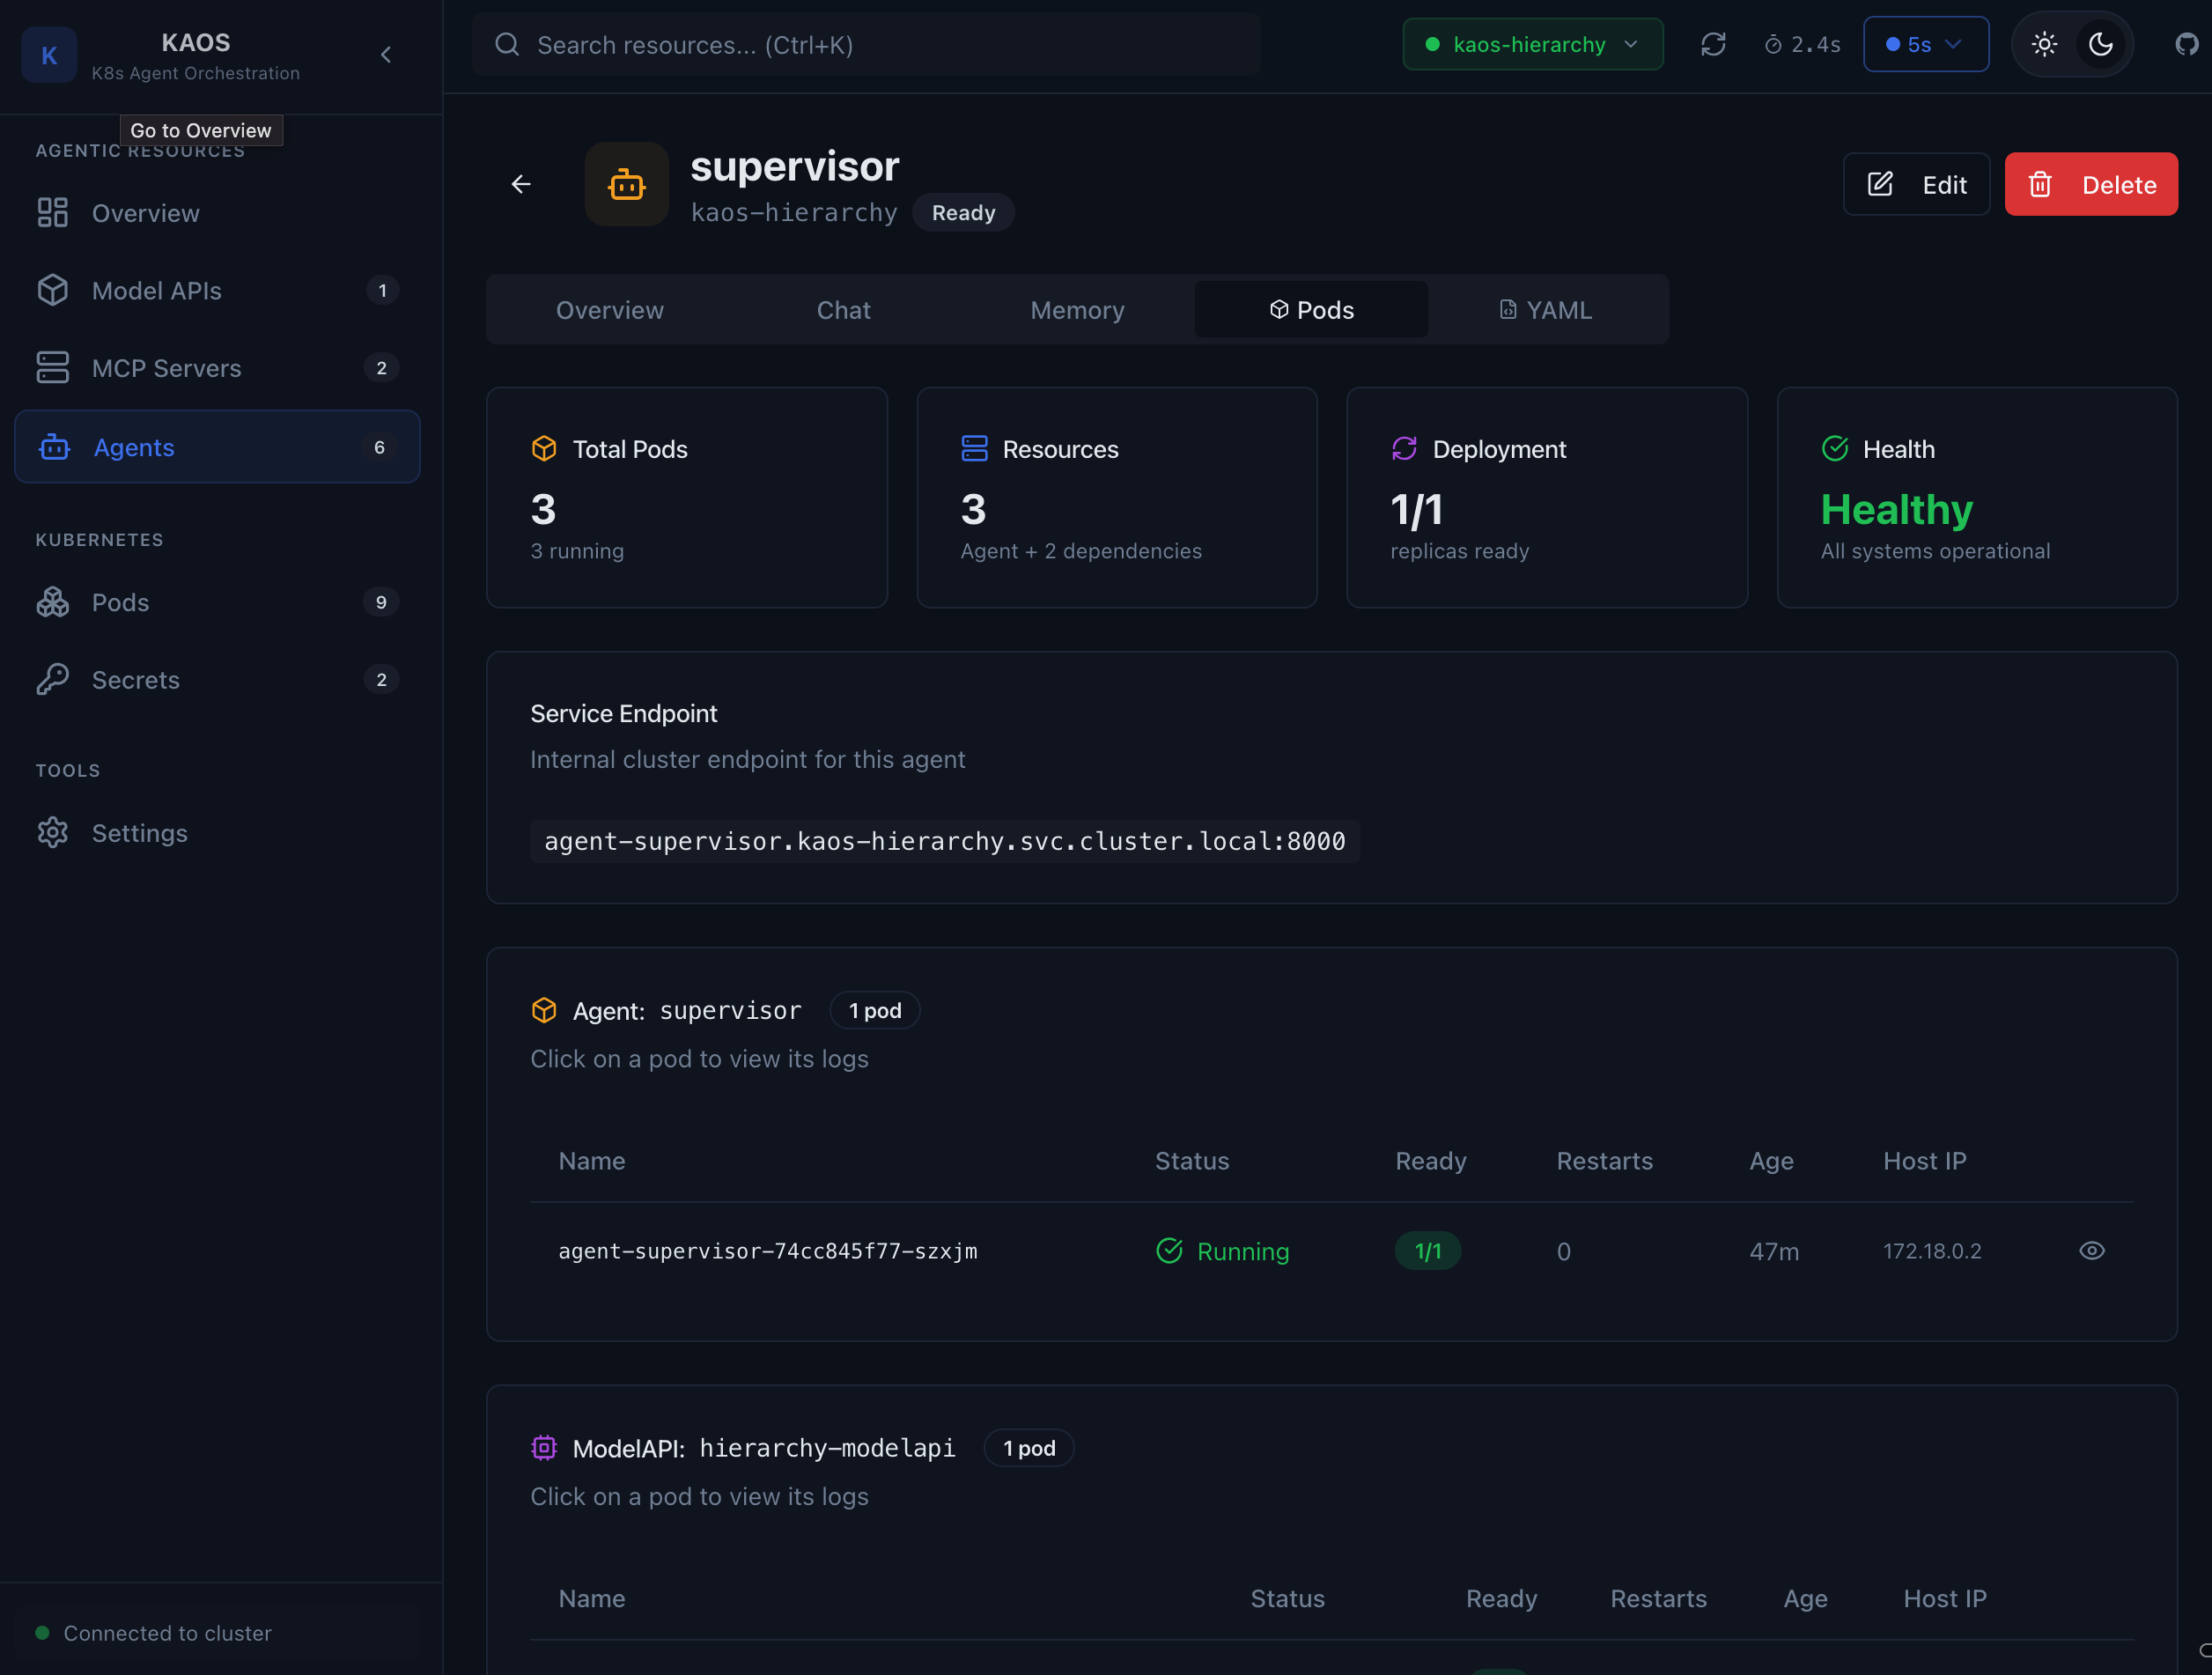
Pod information includes:
- Pod name and status
- Container health
- Restart count
- Node placement
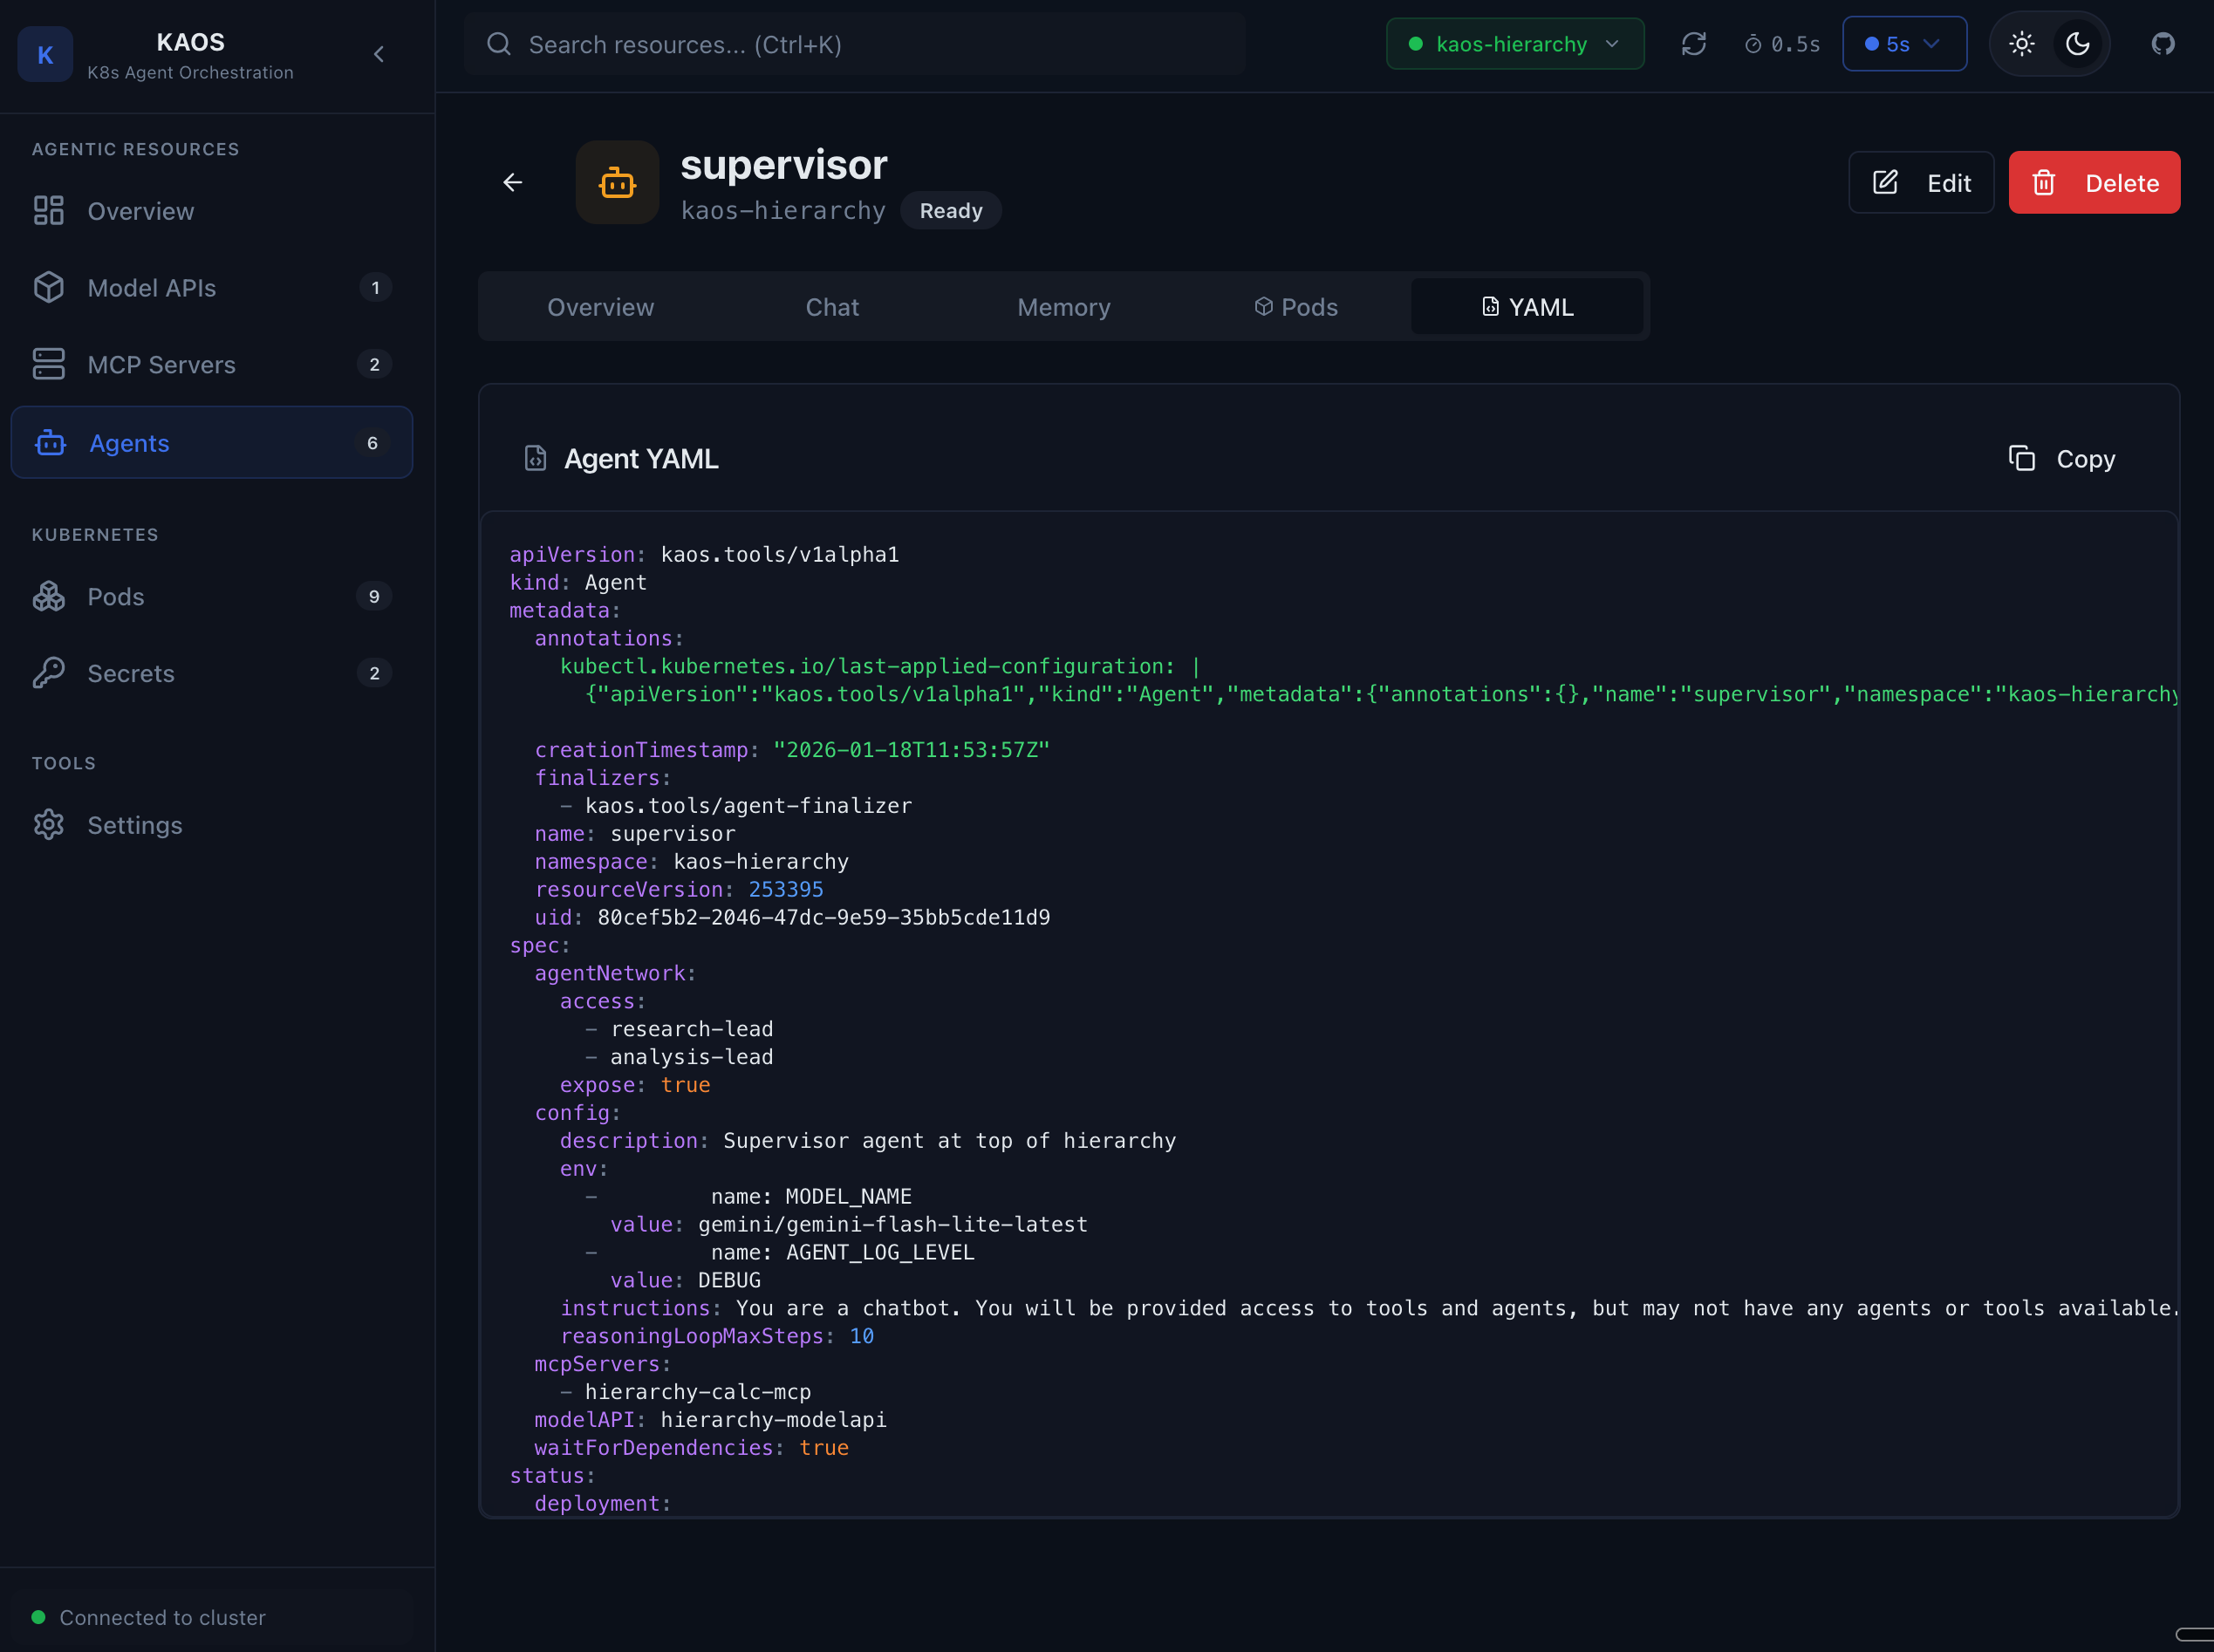
Agent YAML
View and understand the agent's Kubernetes resource definition.
Create Agent
Create new agents using the visual form.
The creation form allows:
- Setting agent name and description
- Defining instructions
- Selecting model API
- Attaching MCP servers
- Configuring agent network
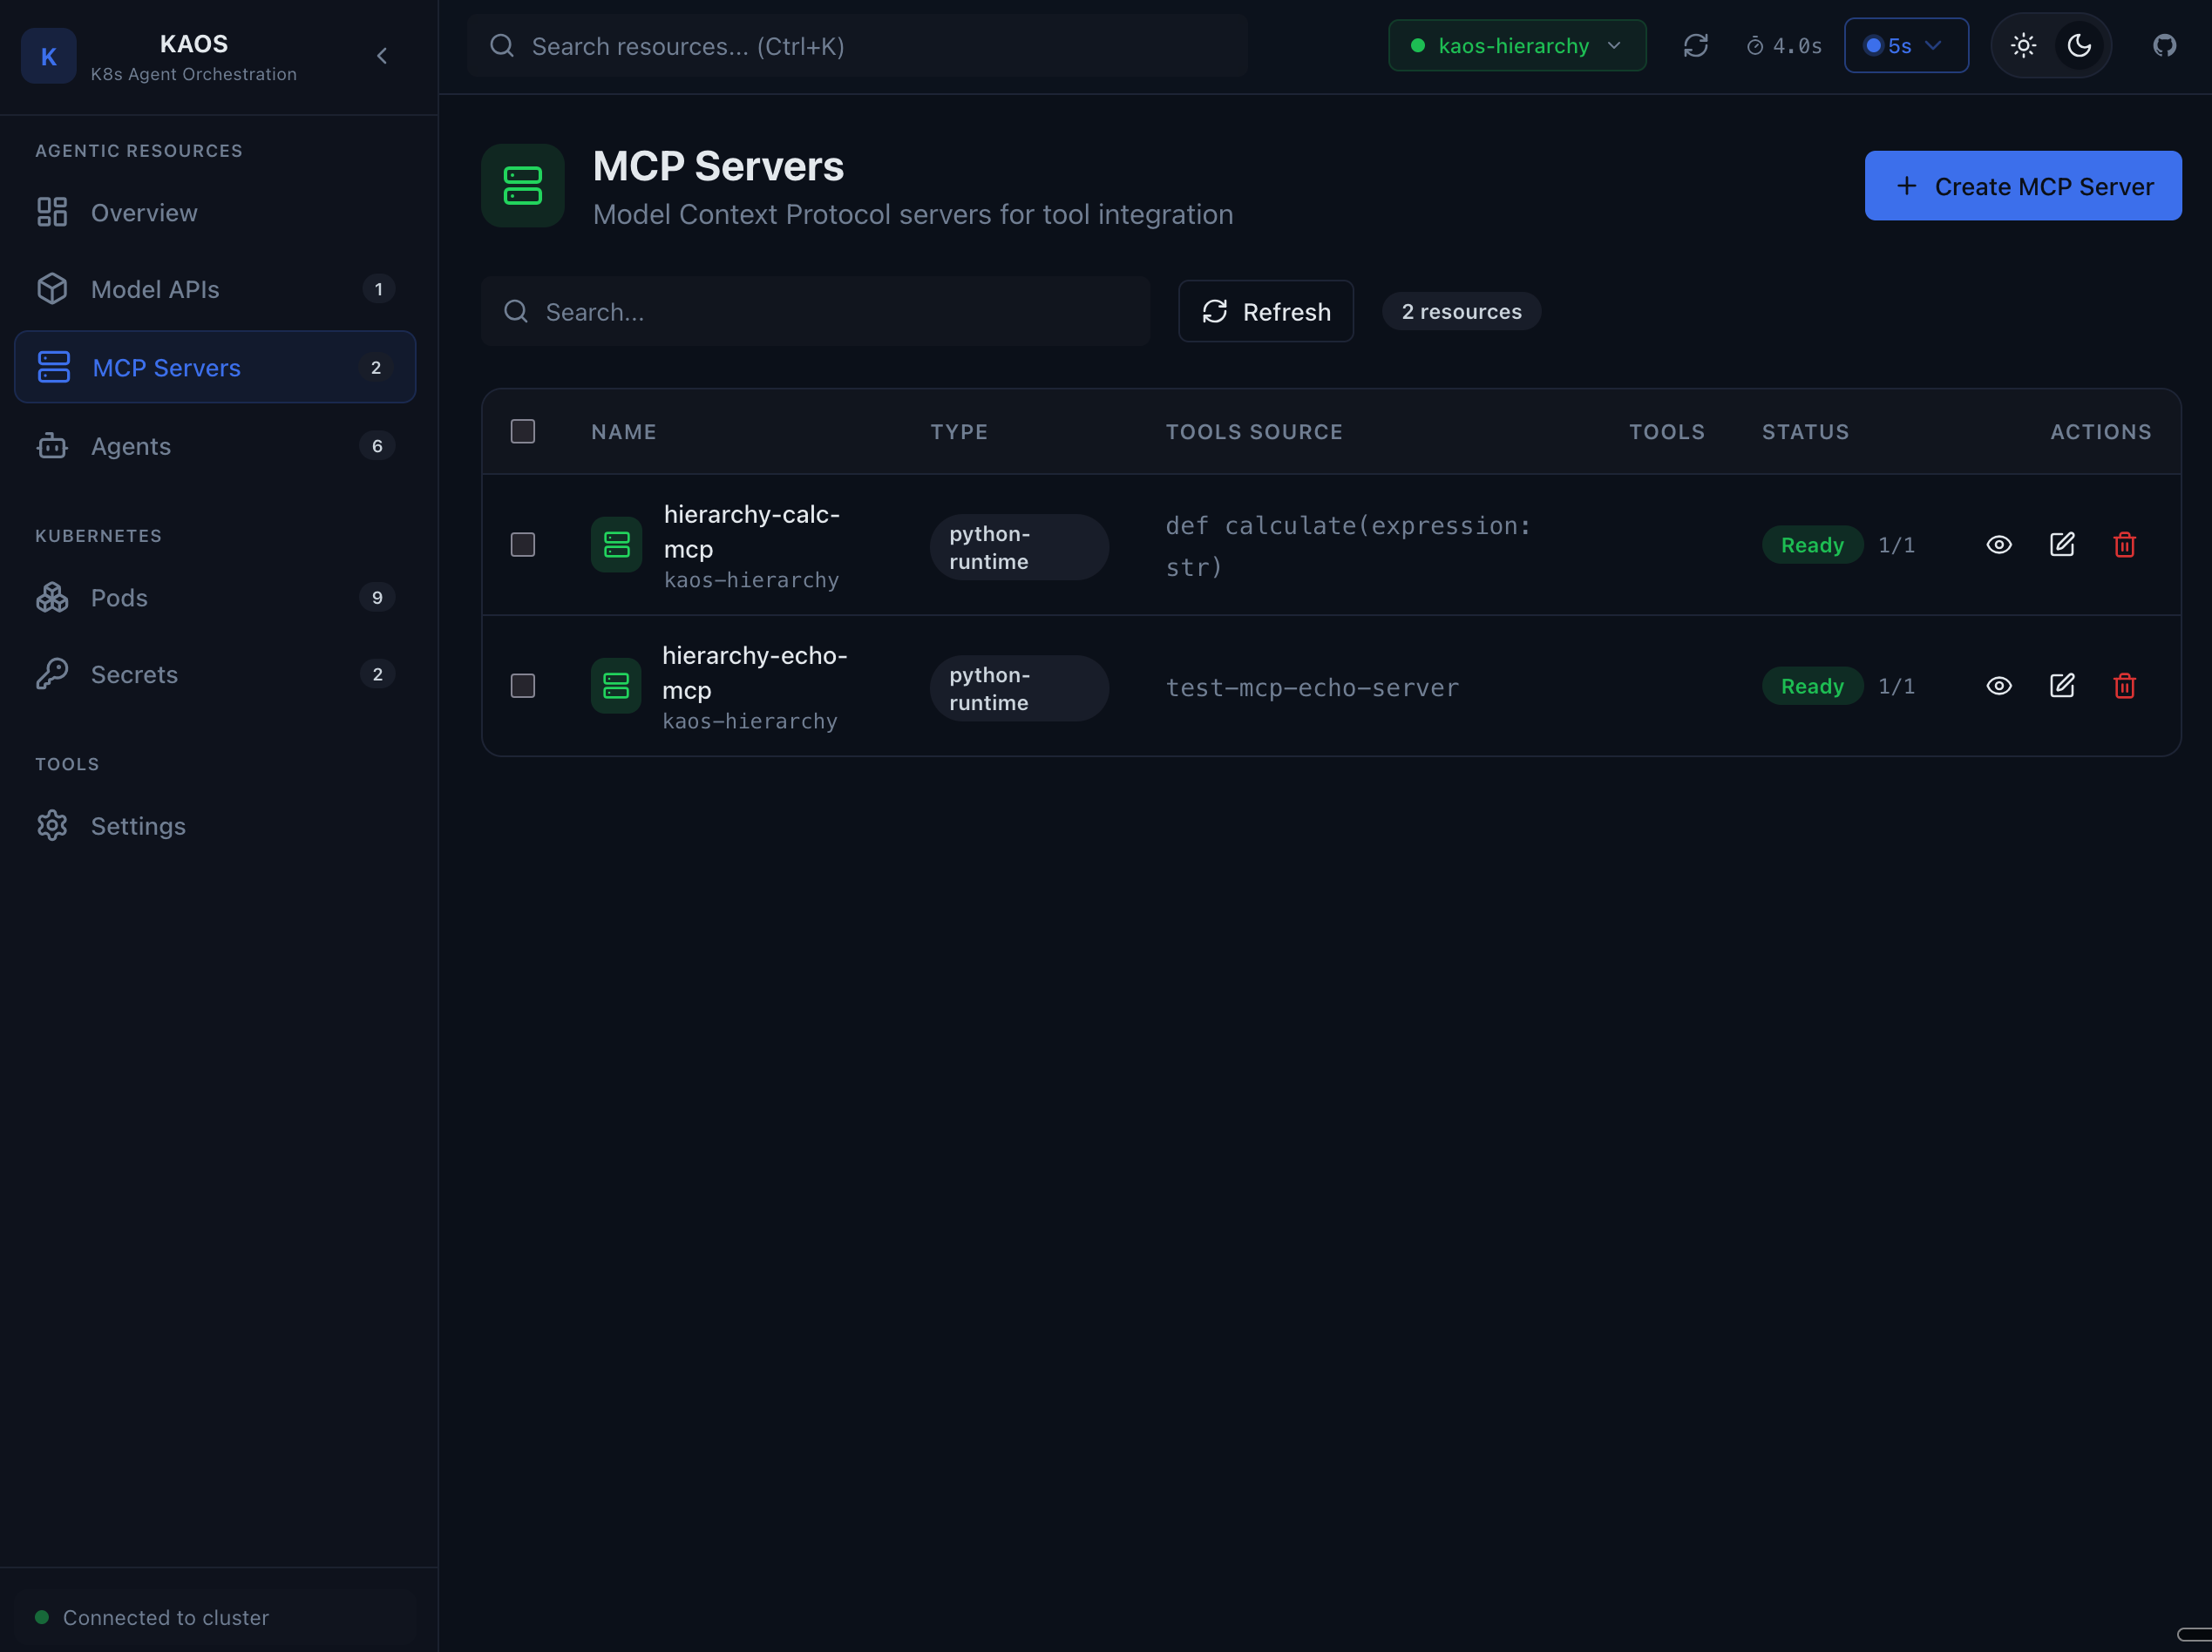
MCP Servers
MCP Server List
View all MCP (Model Context Protocol) servers in your namespace.
MCP Server Overview
See MCP server configuration and available tools.
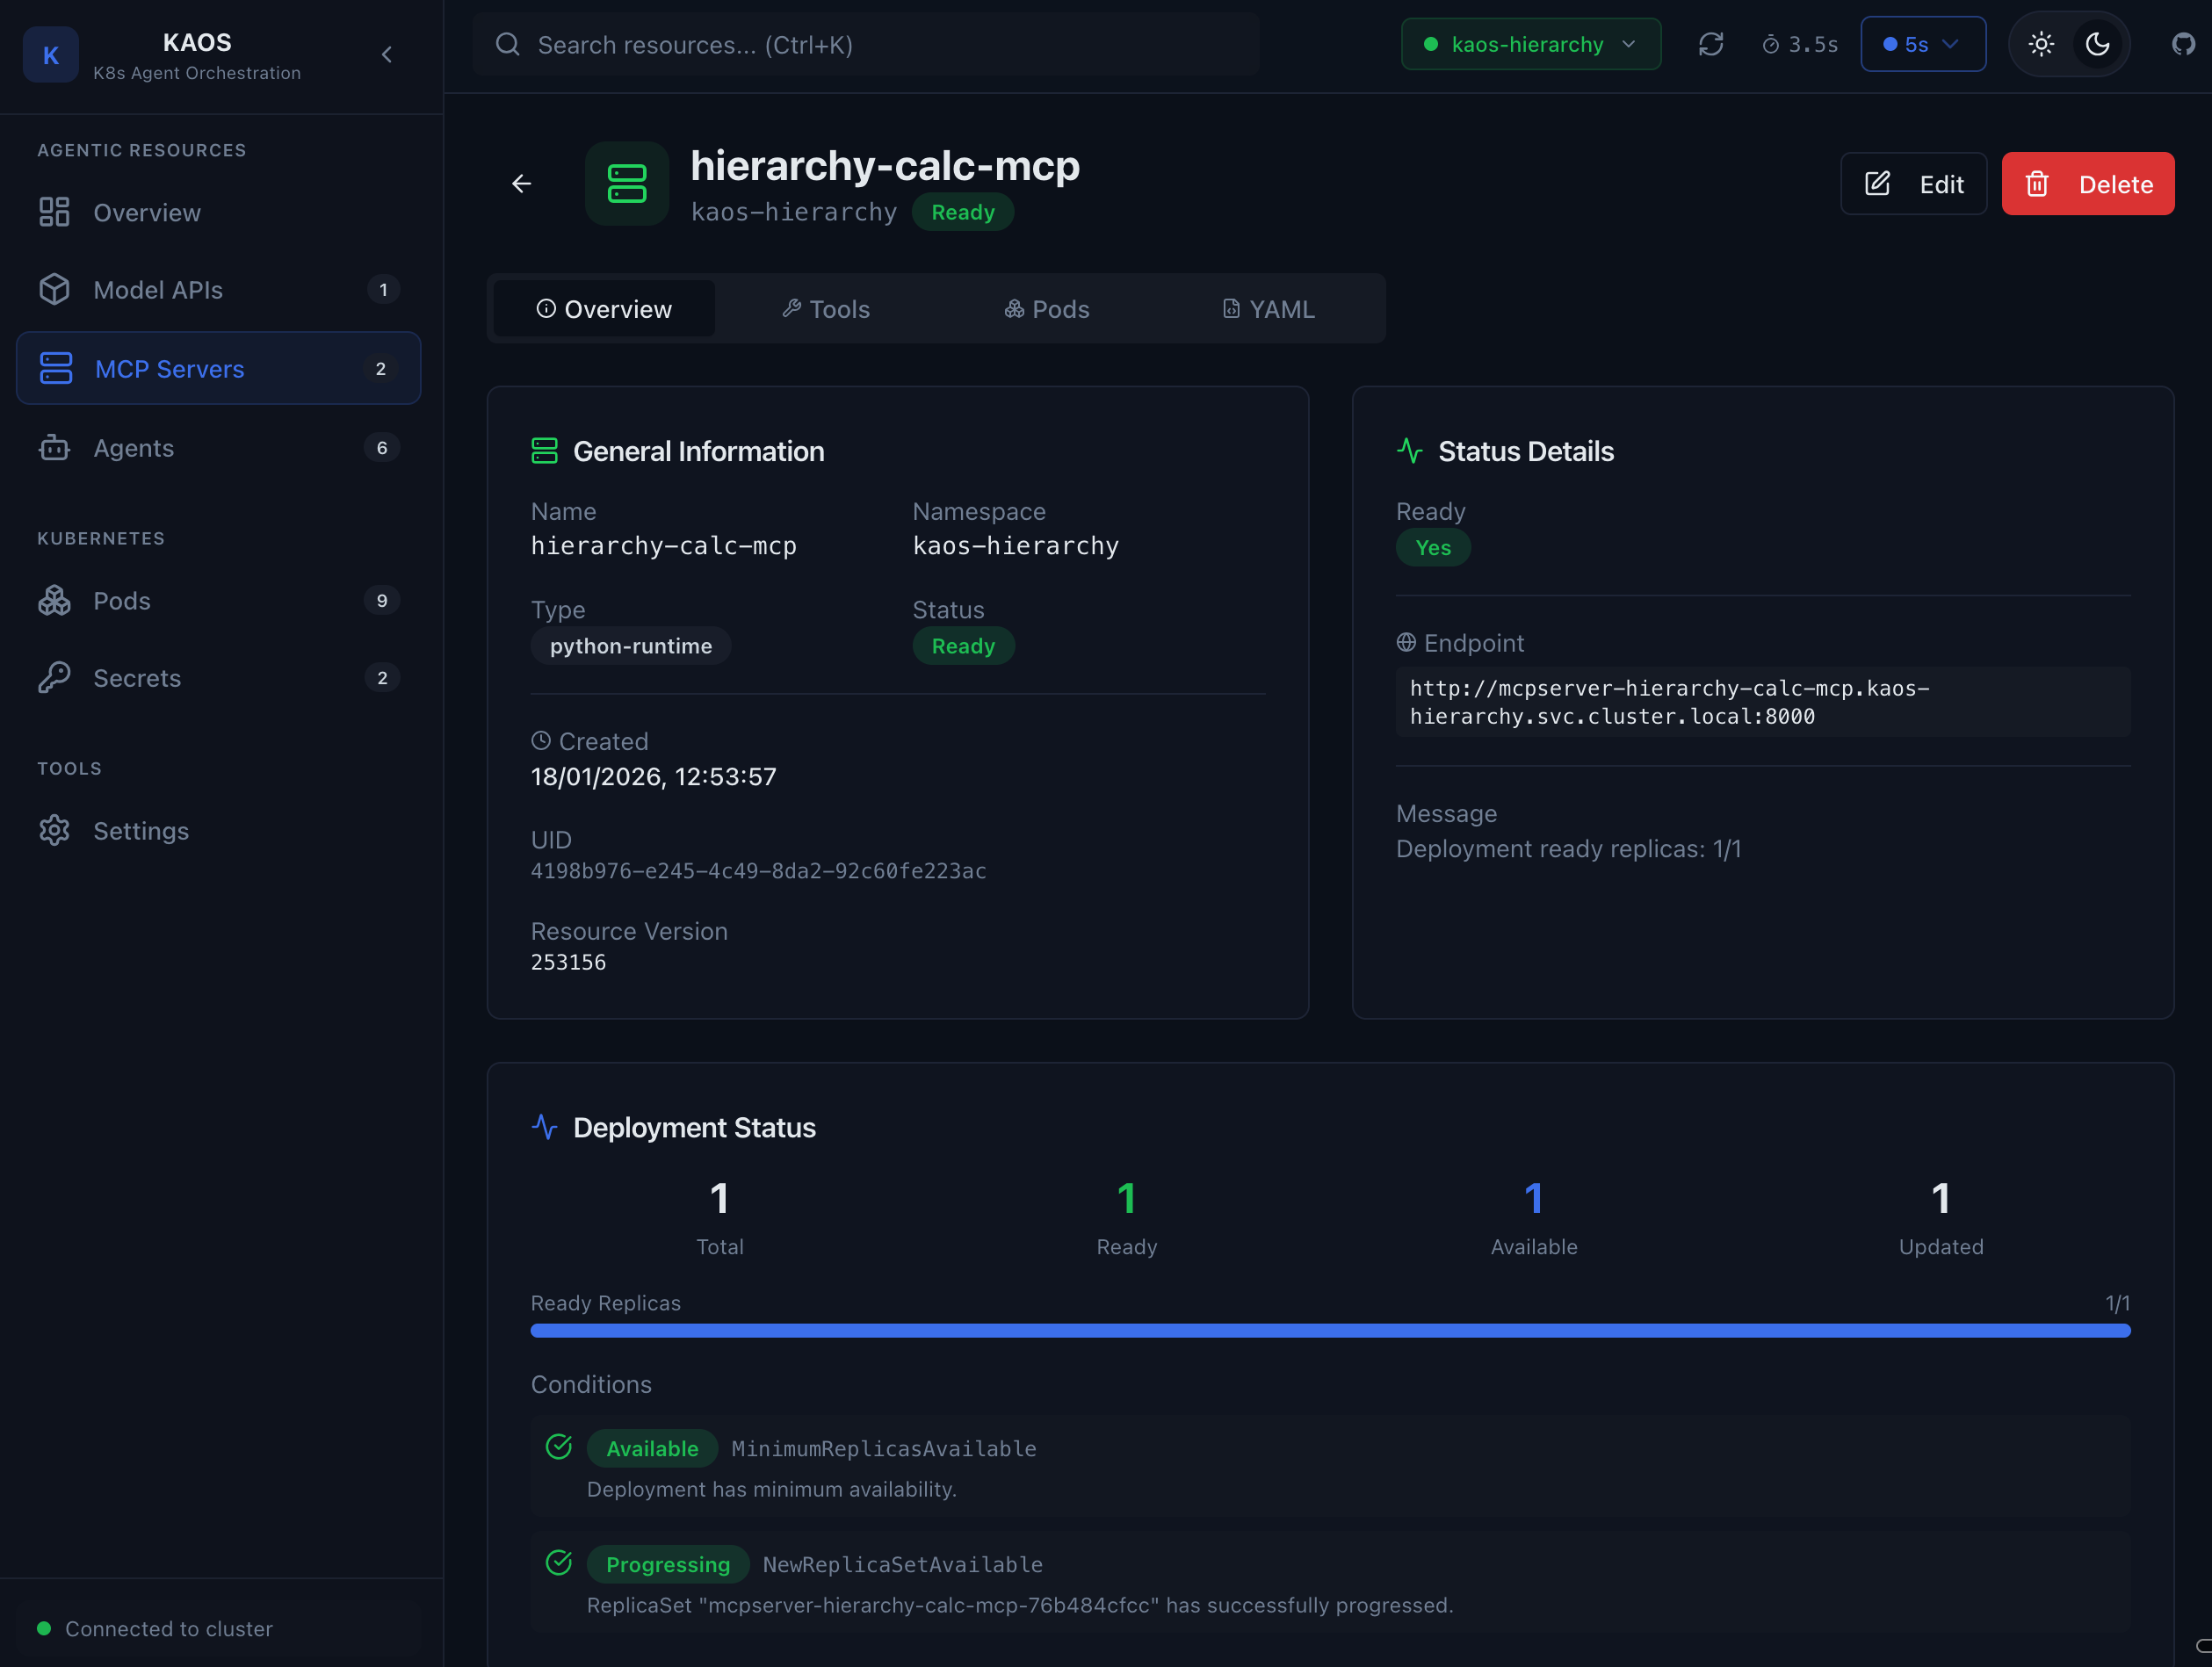
The overview shows:
- Server configuration
- Registered tools and their schemas
- Deployment status
Tool Debugging
Test MCP tools directly from the UI.
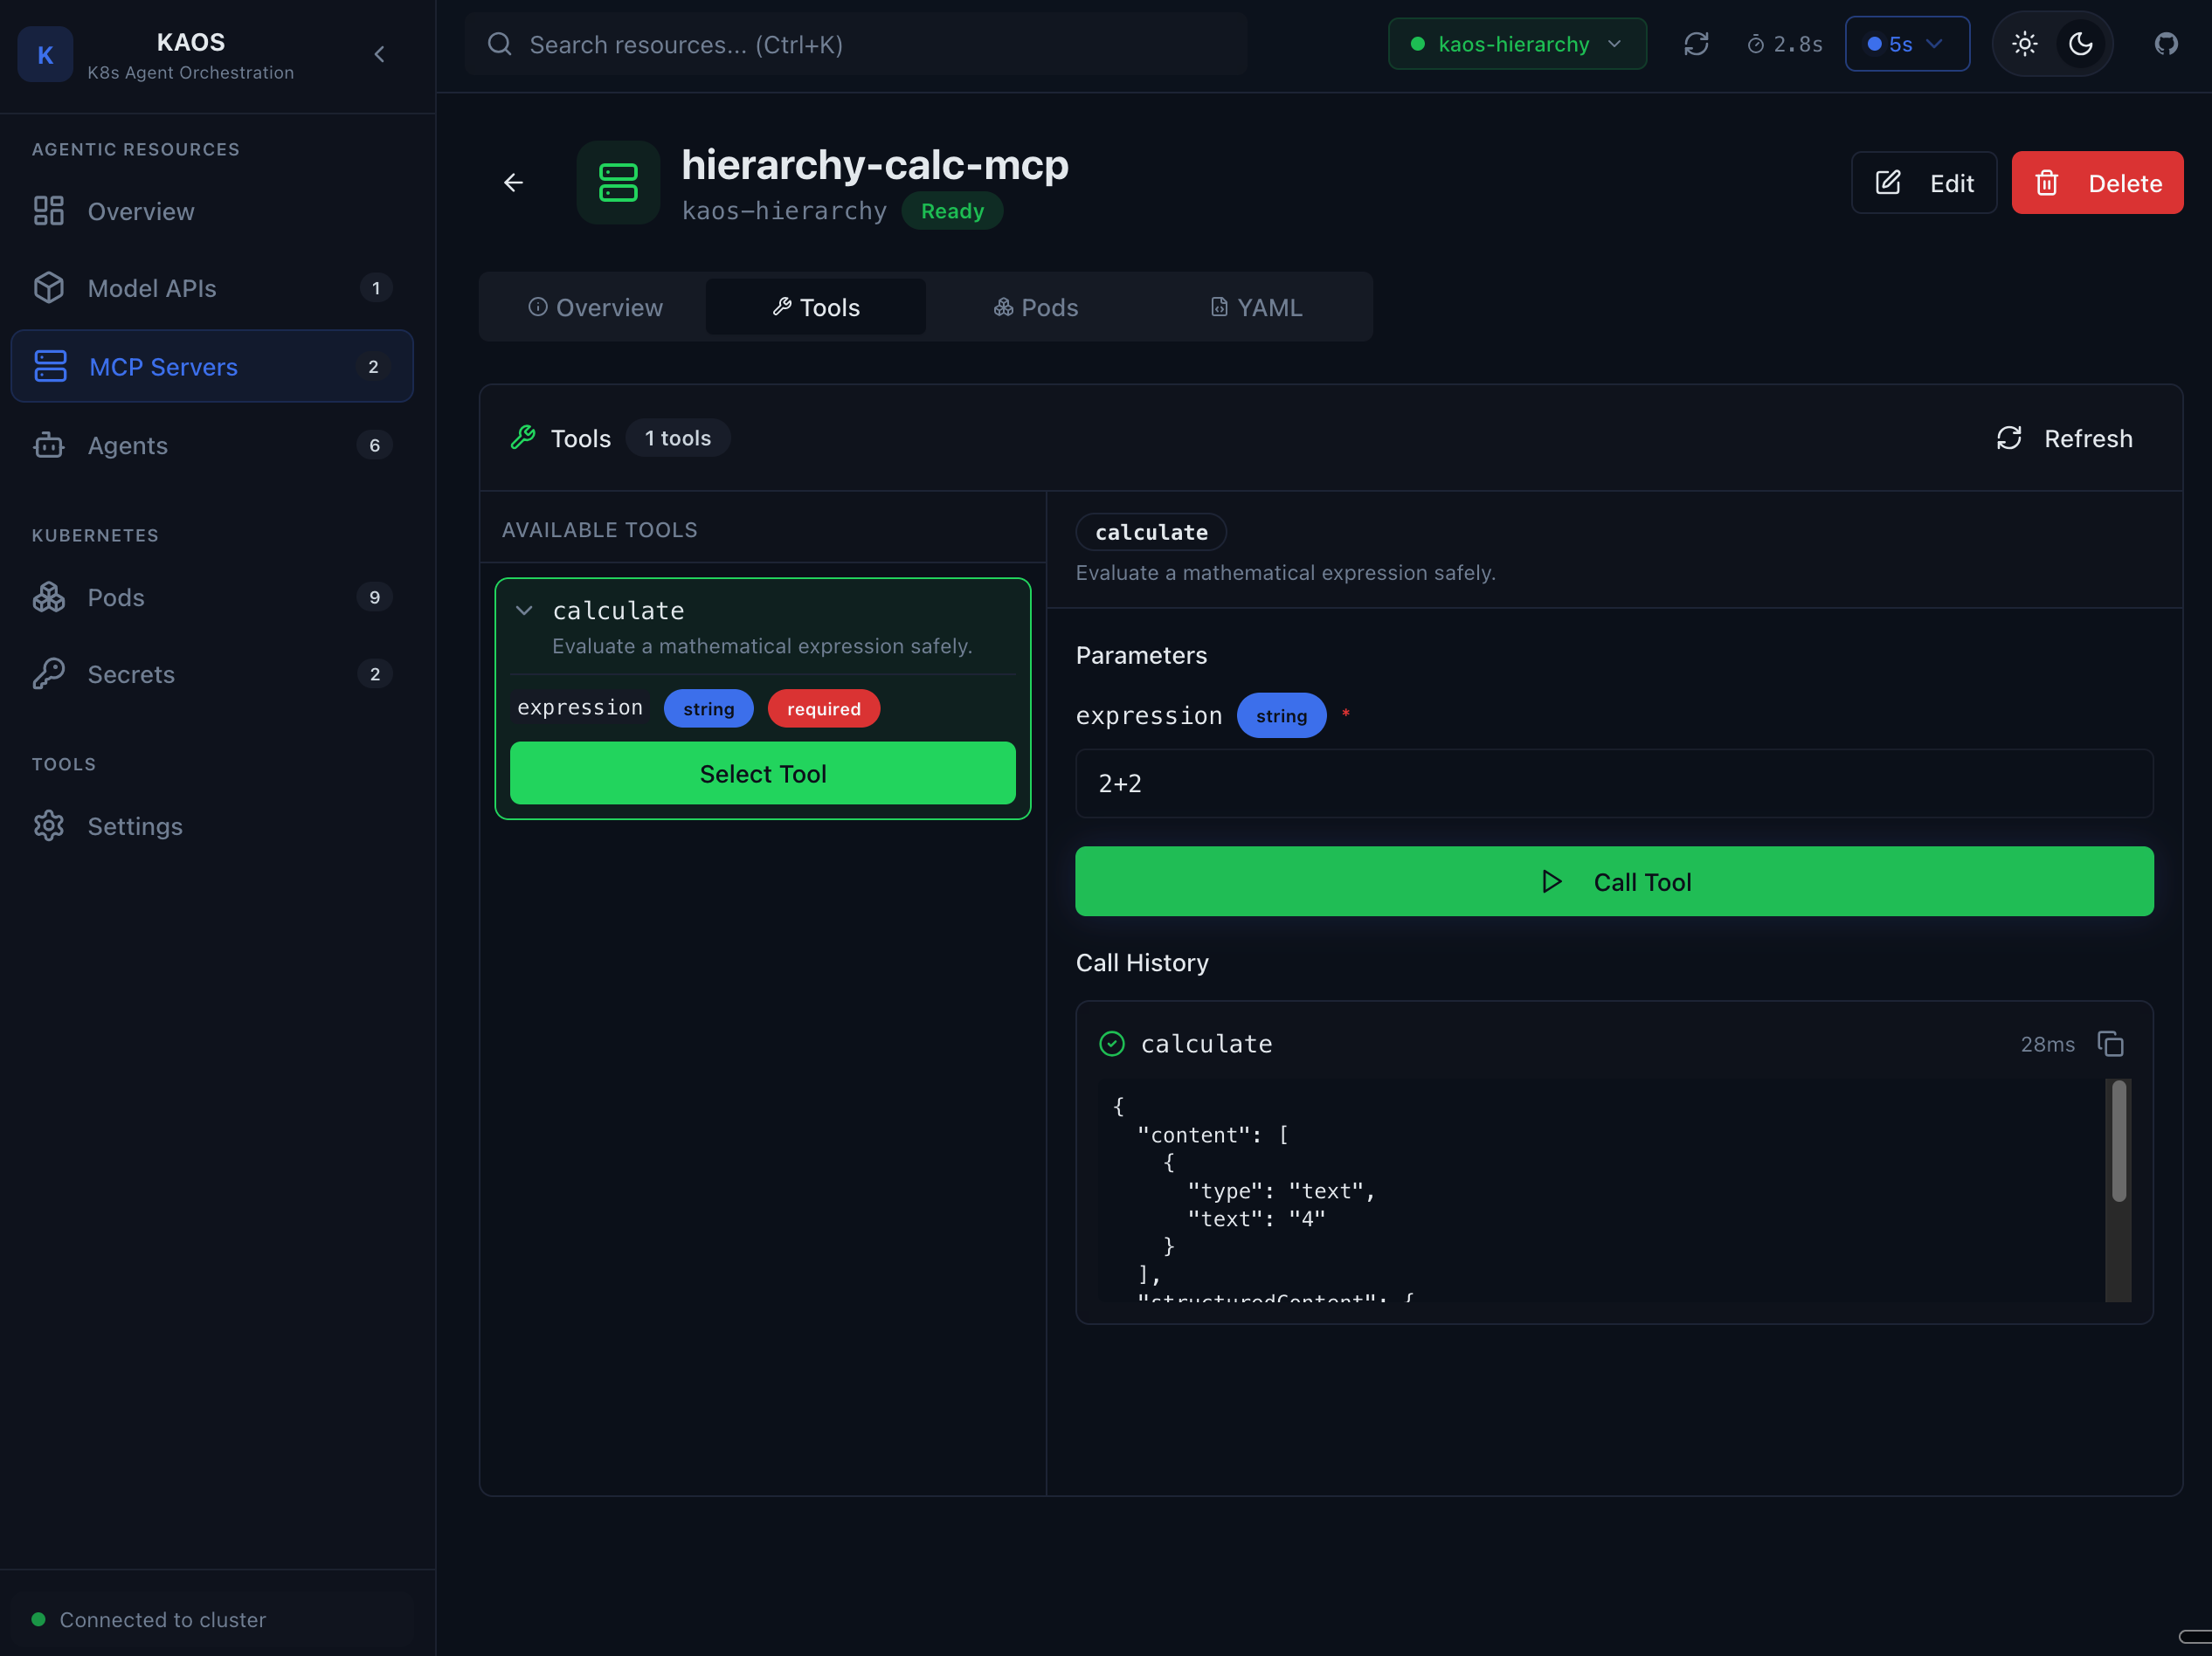
The tool debug interface allows:
- Select a tool to test
- Input test arguments
- Execute the tool
- View results
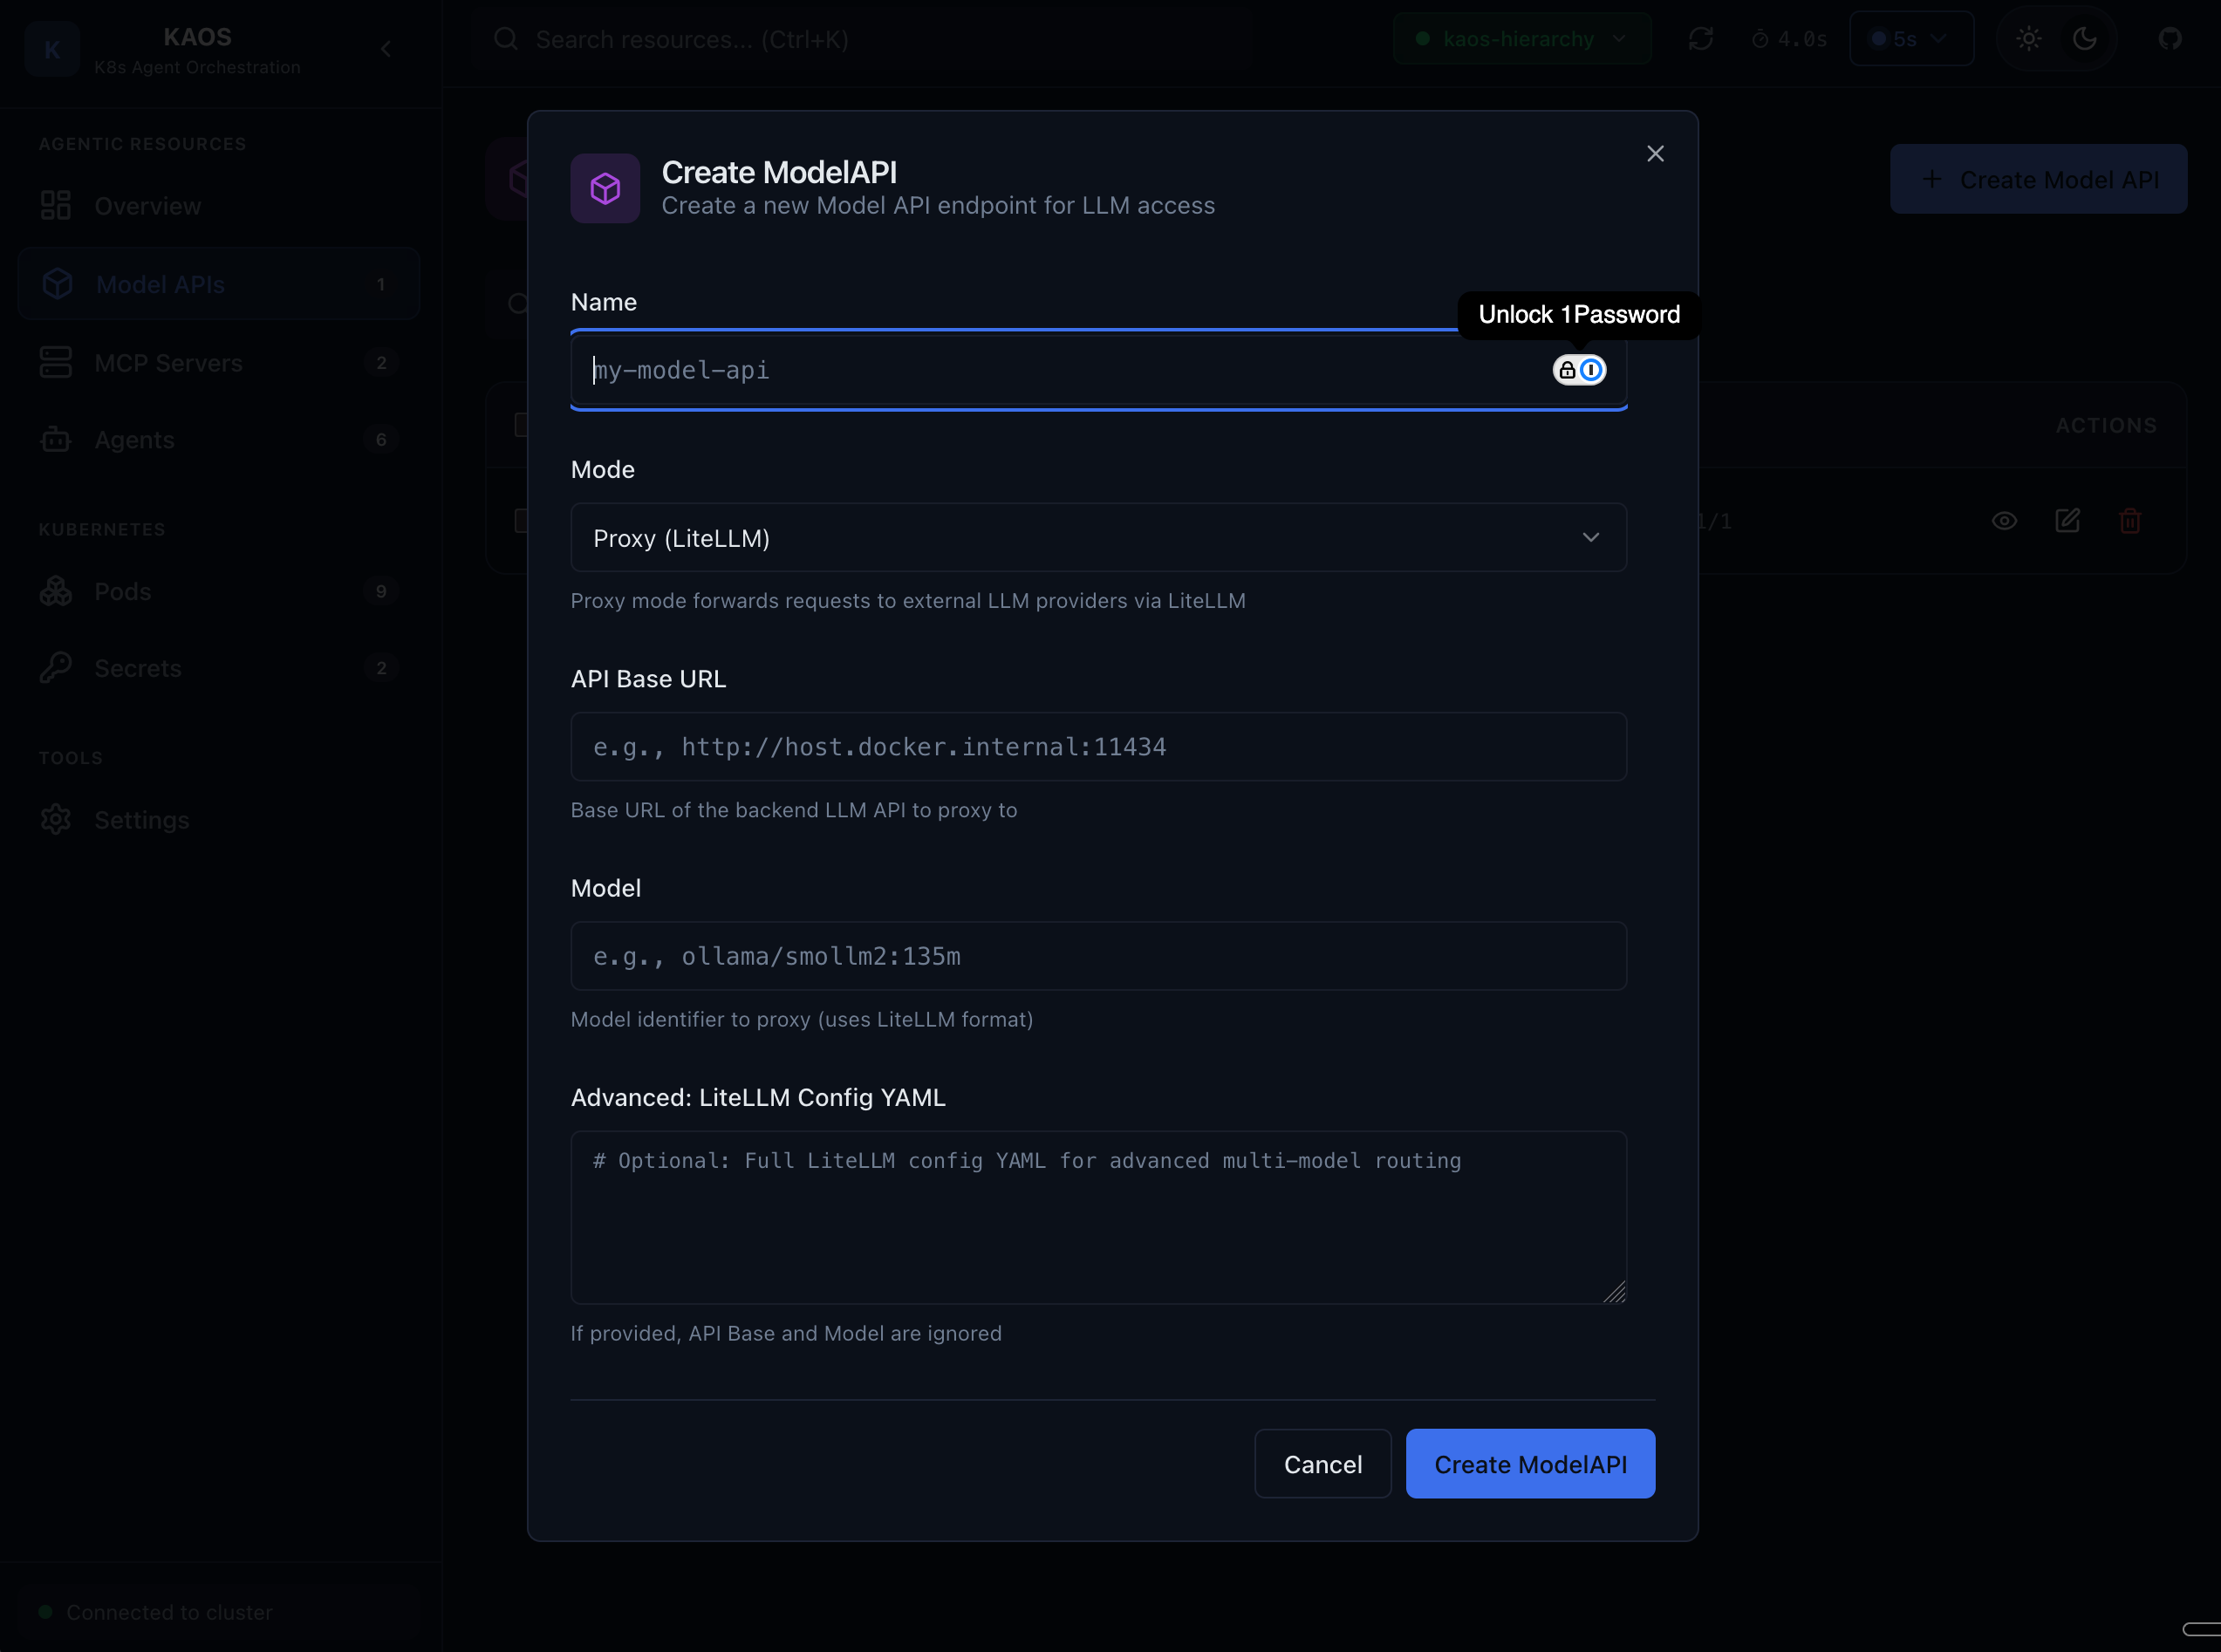
Model APIs
Model API List
View all model API configurations.
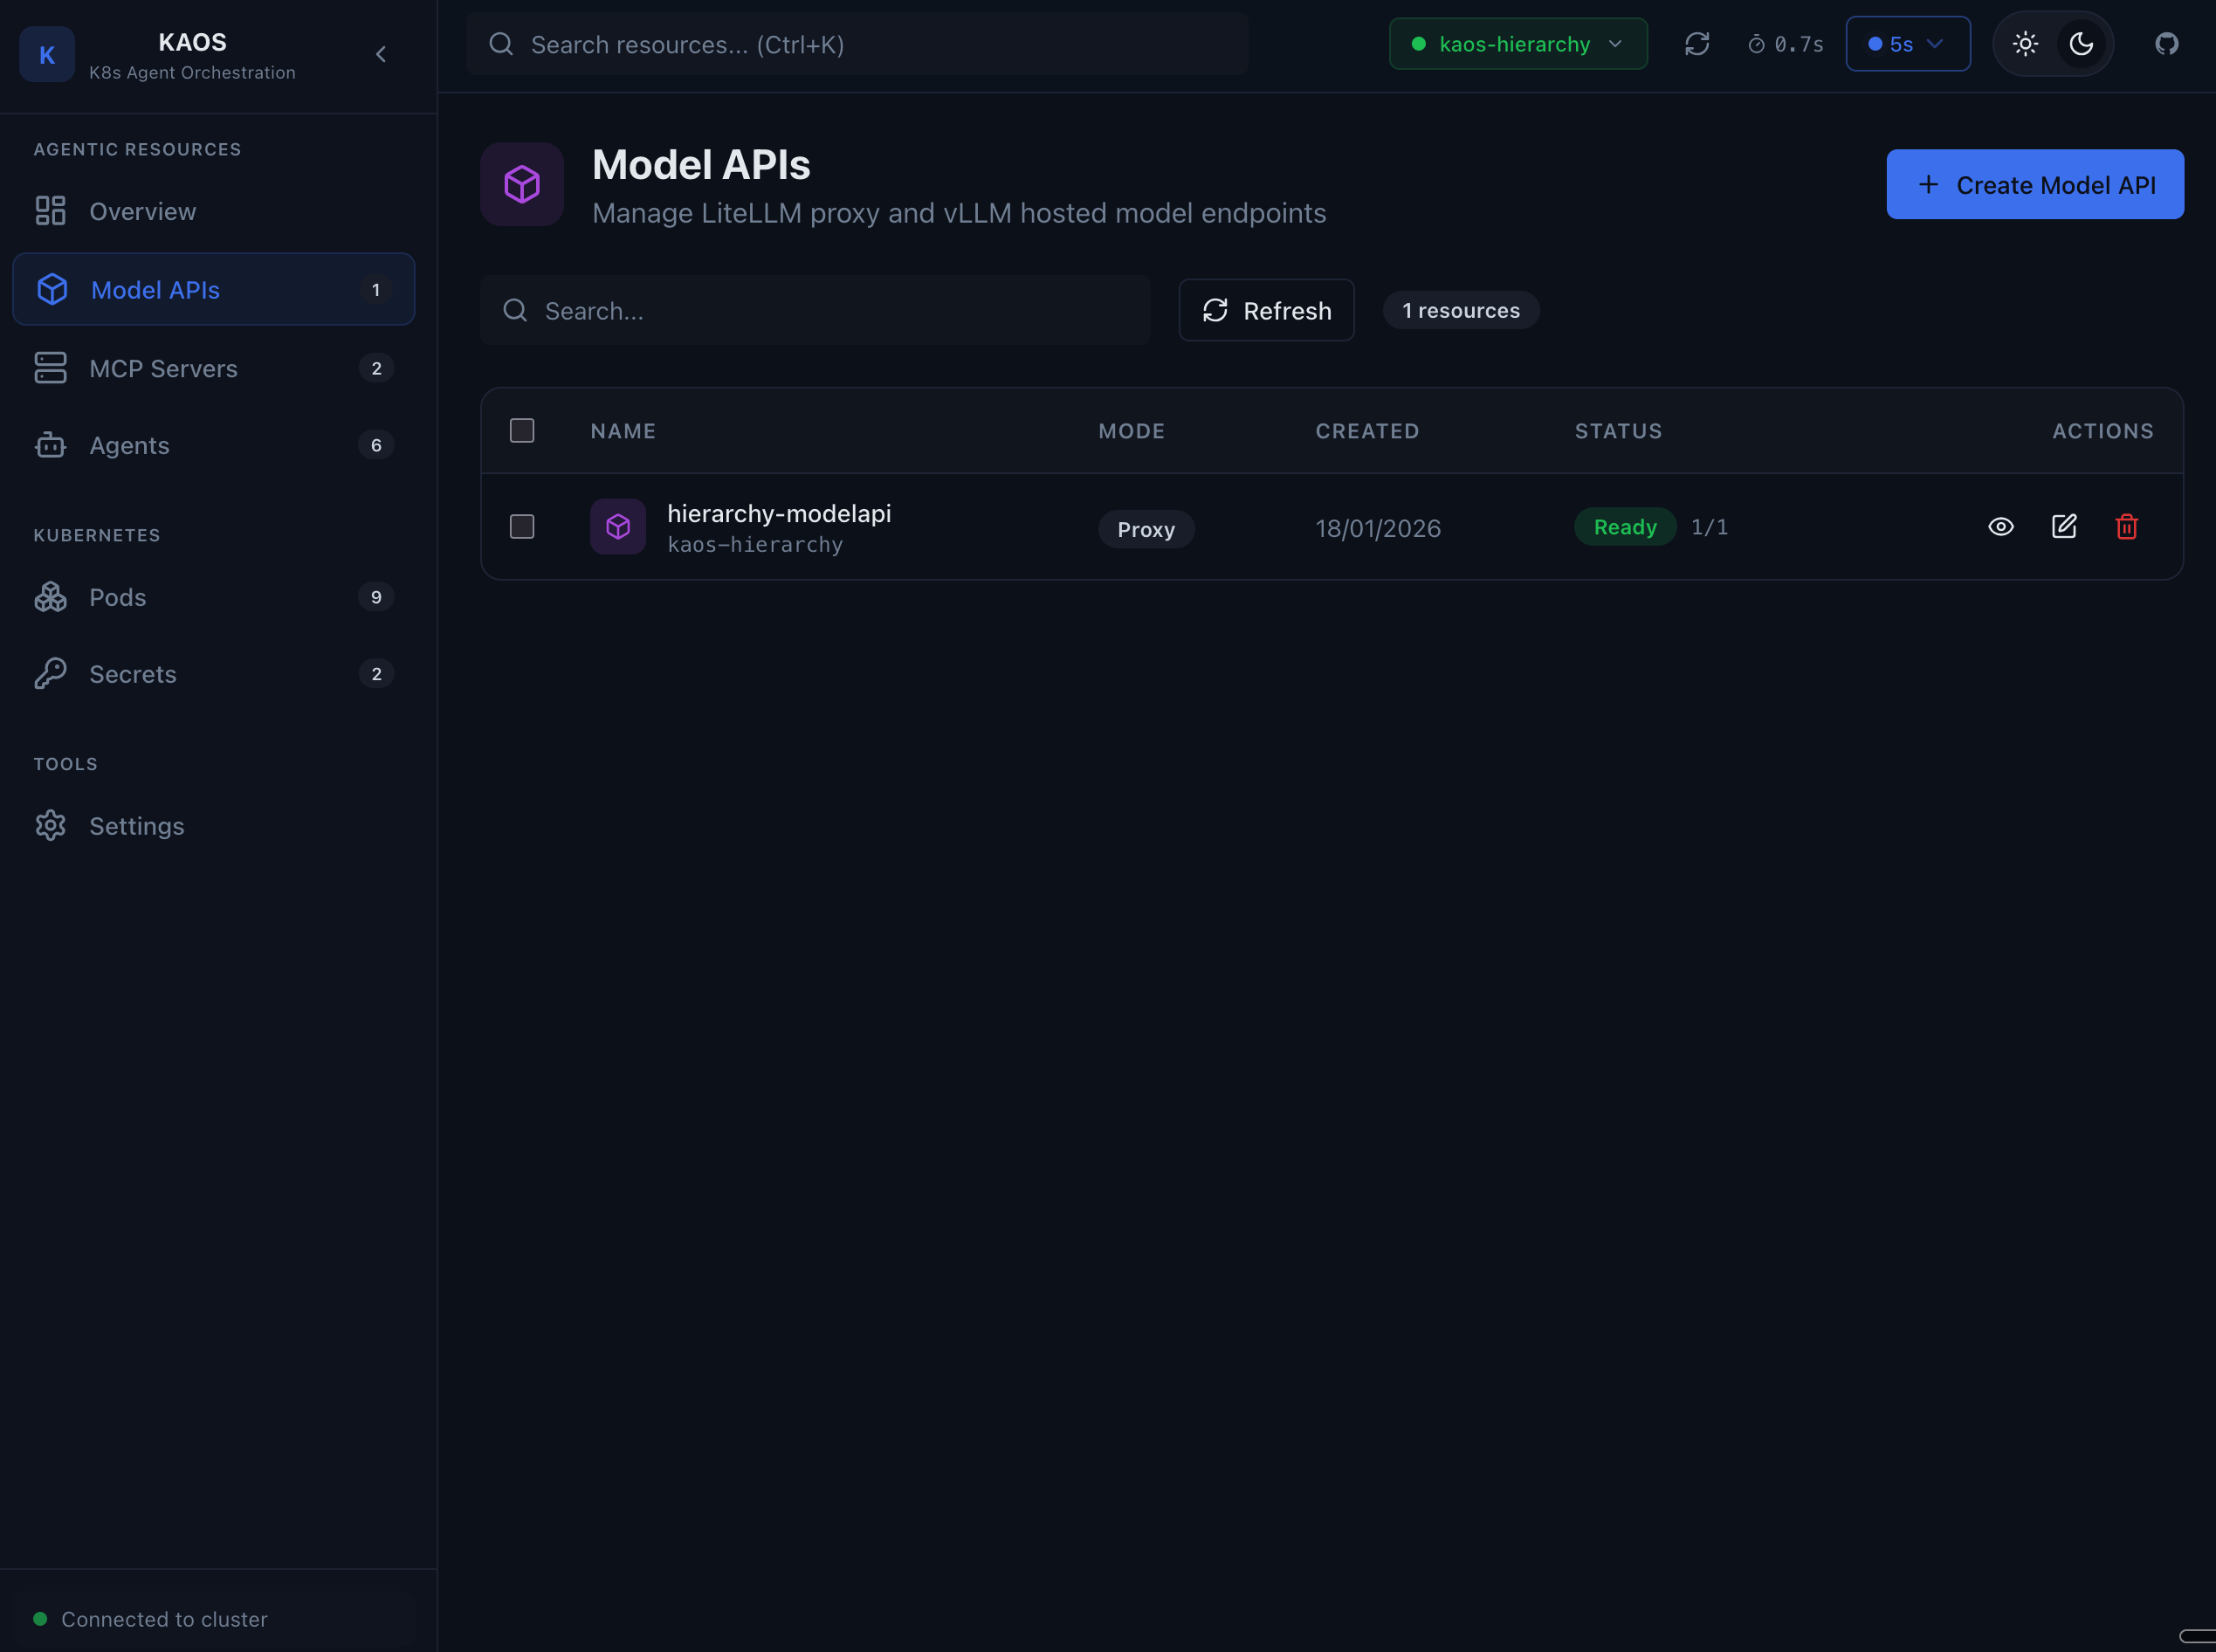
Shows:
- Model API name and mode (Proxy/Hosted)
- Endpoint URL
- Health status
Model Debug
Test model API connectivity and responses.
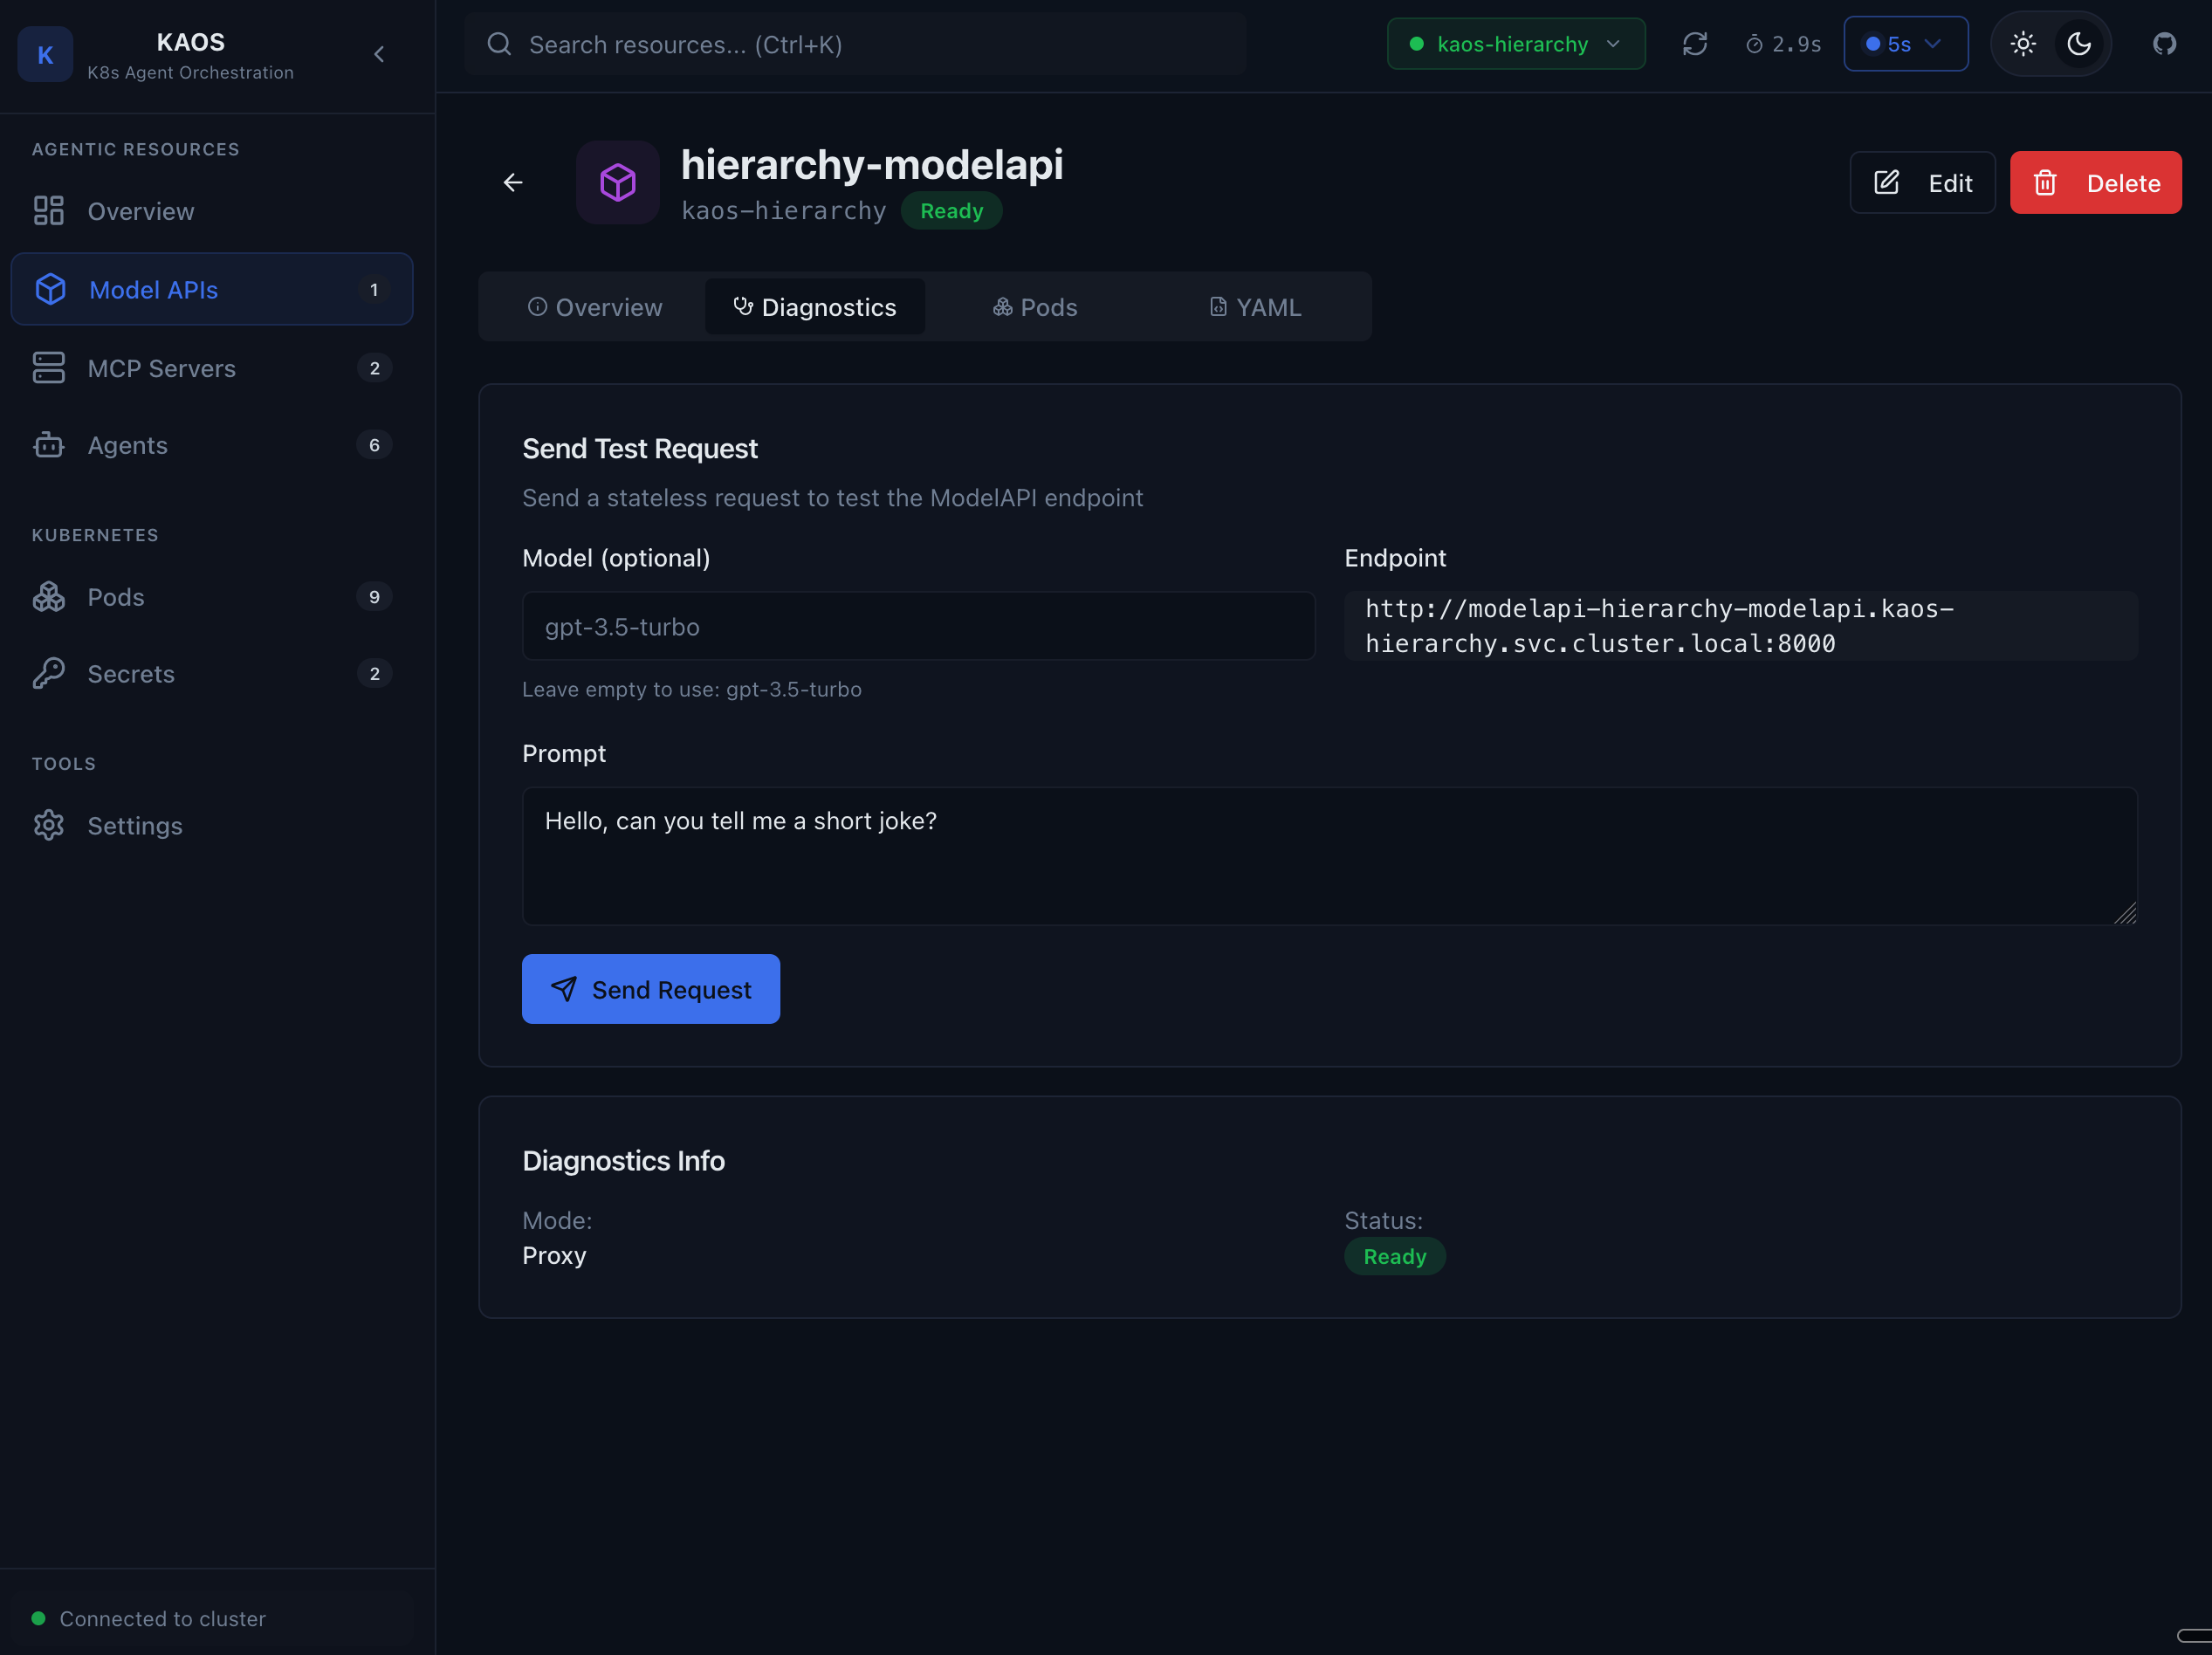
The debug interface allows:
- Send test prompts to the model
- Verify connectivity
- Check response format
- Debug authentication issues
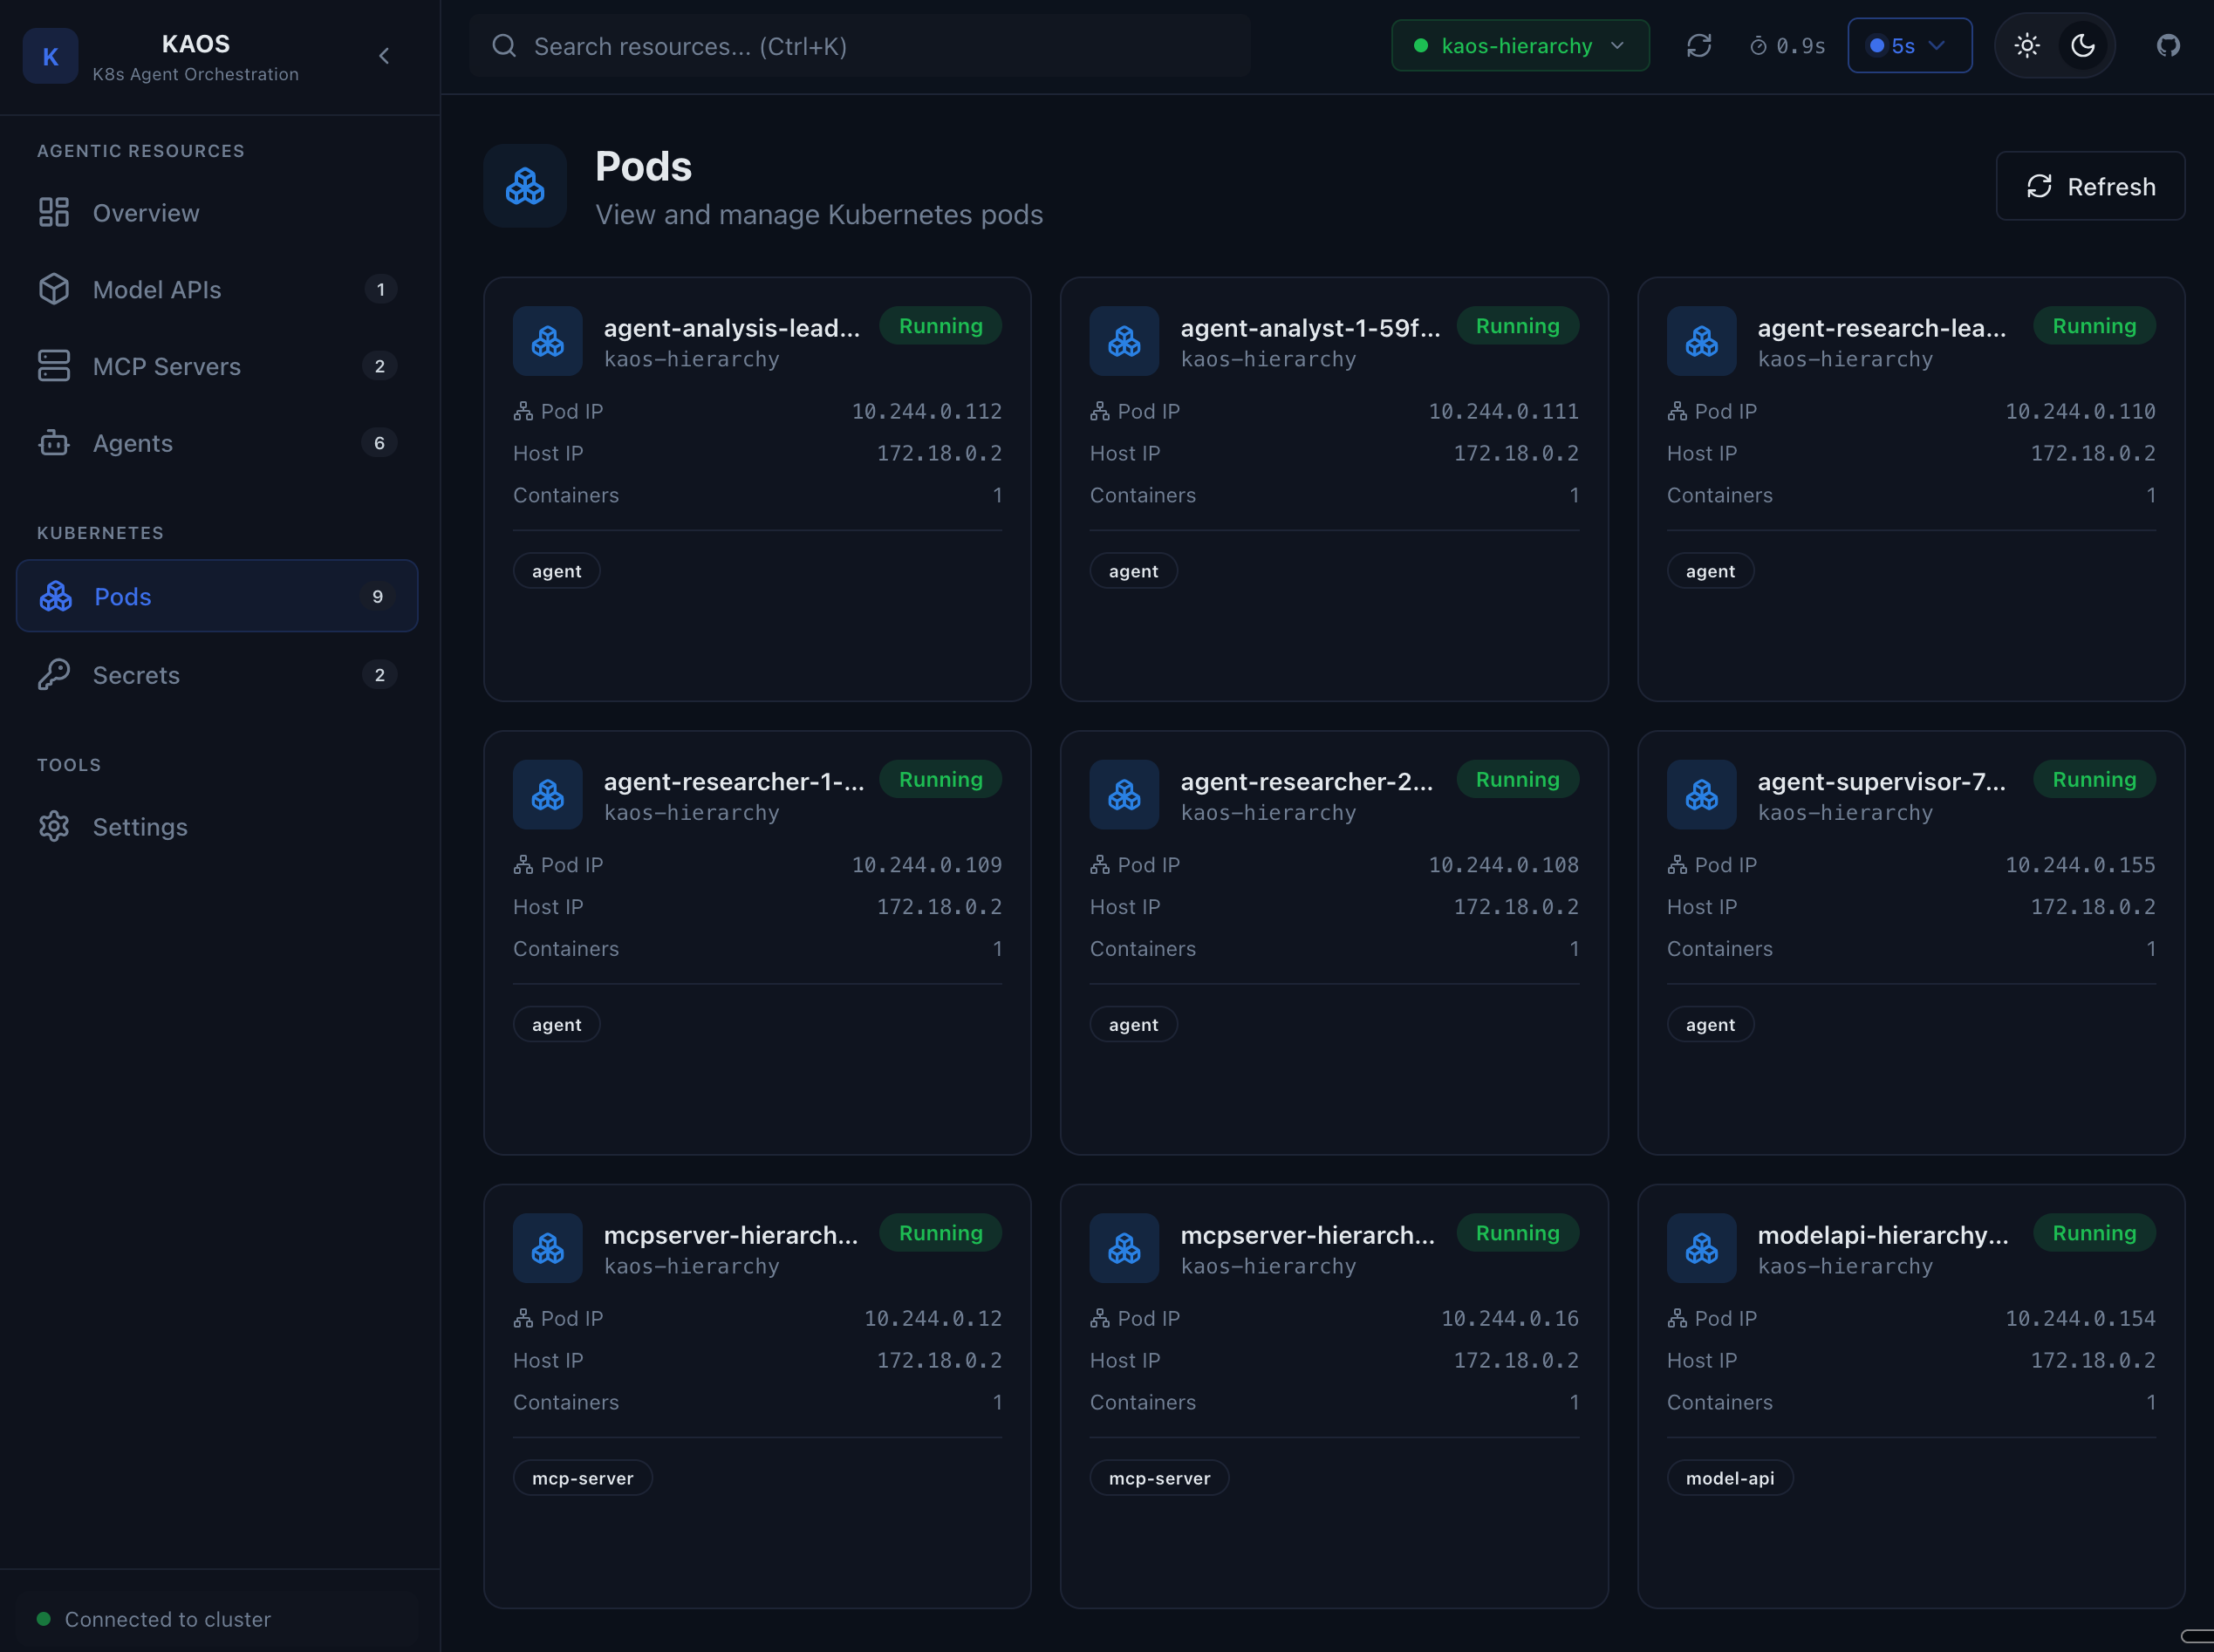
Pods
Pod List
View all pods across your agent resources.
Pod Logs
View real-time logs from any pod.
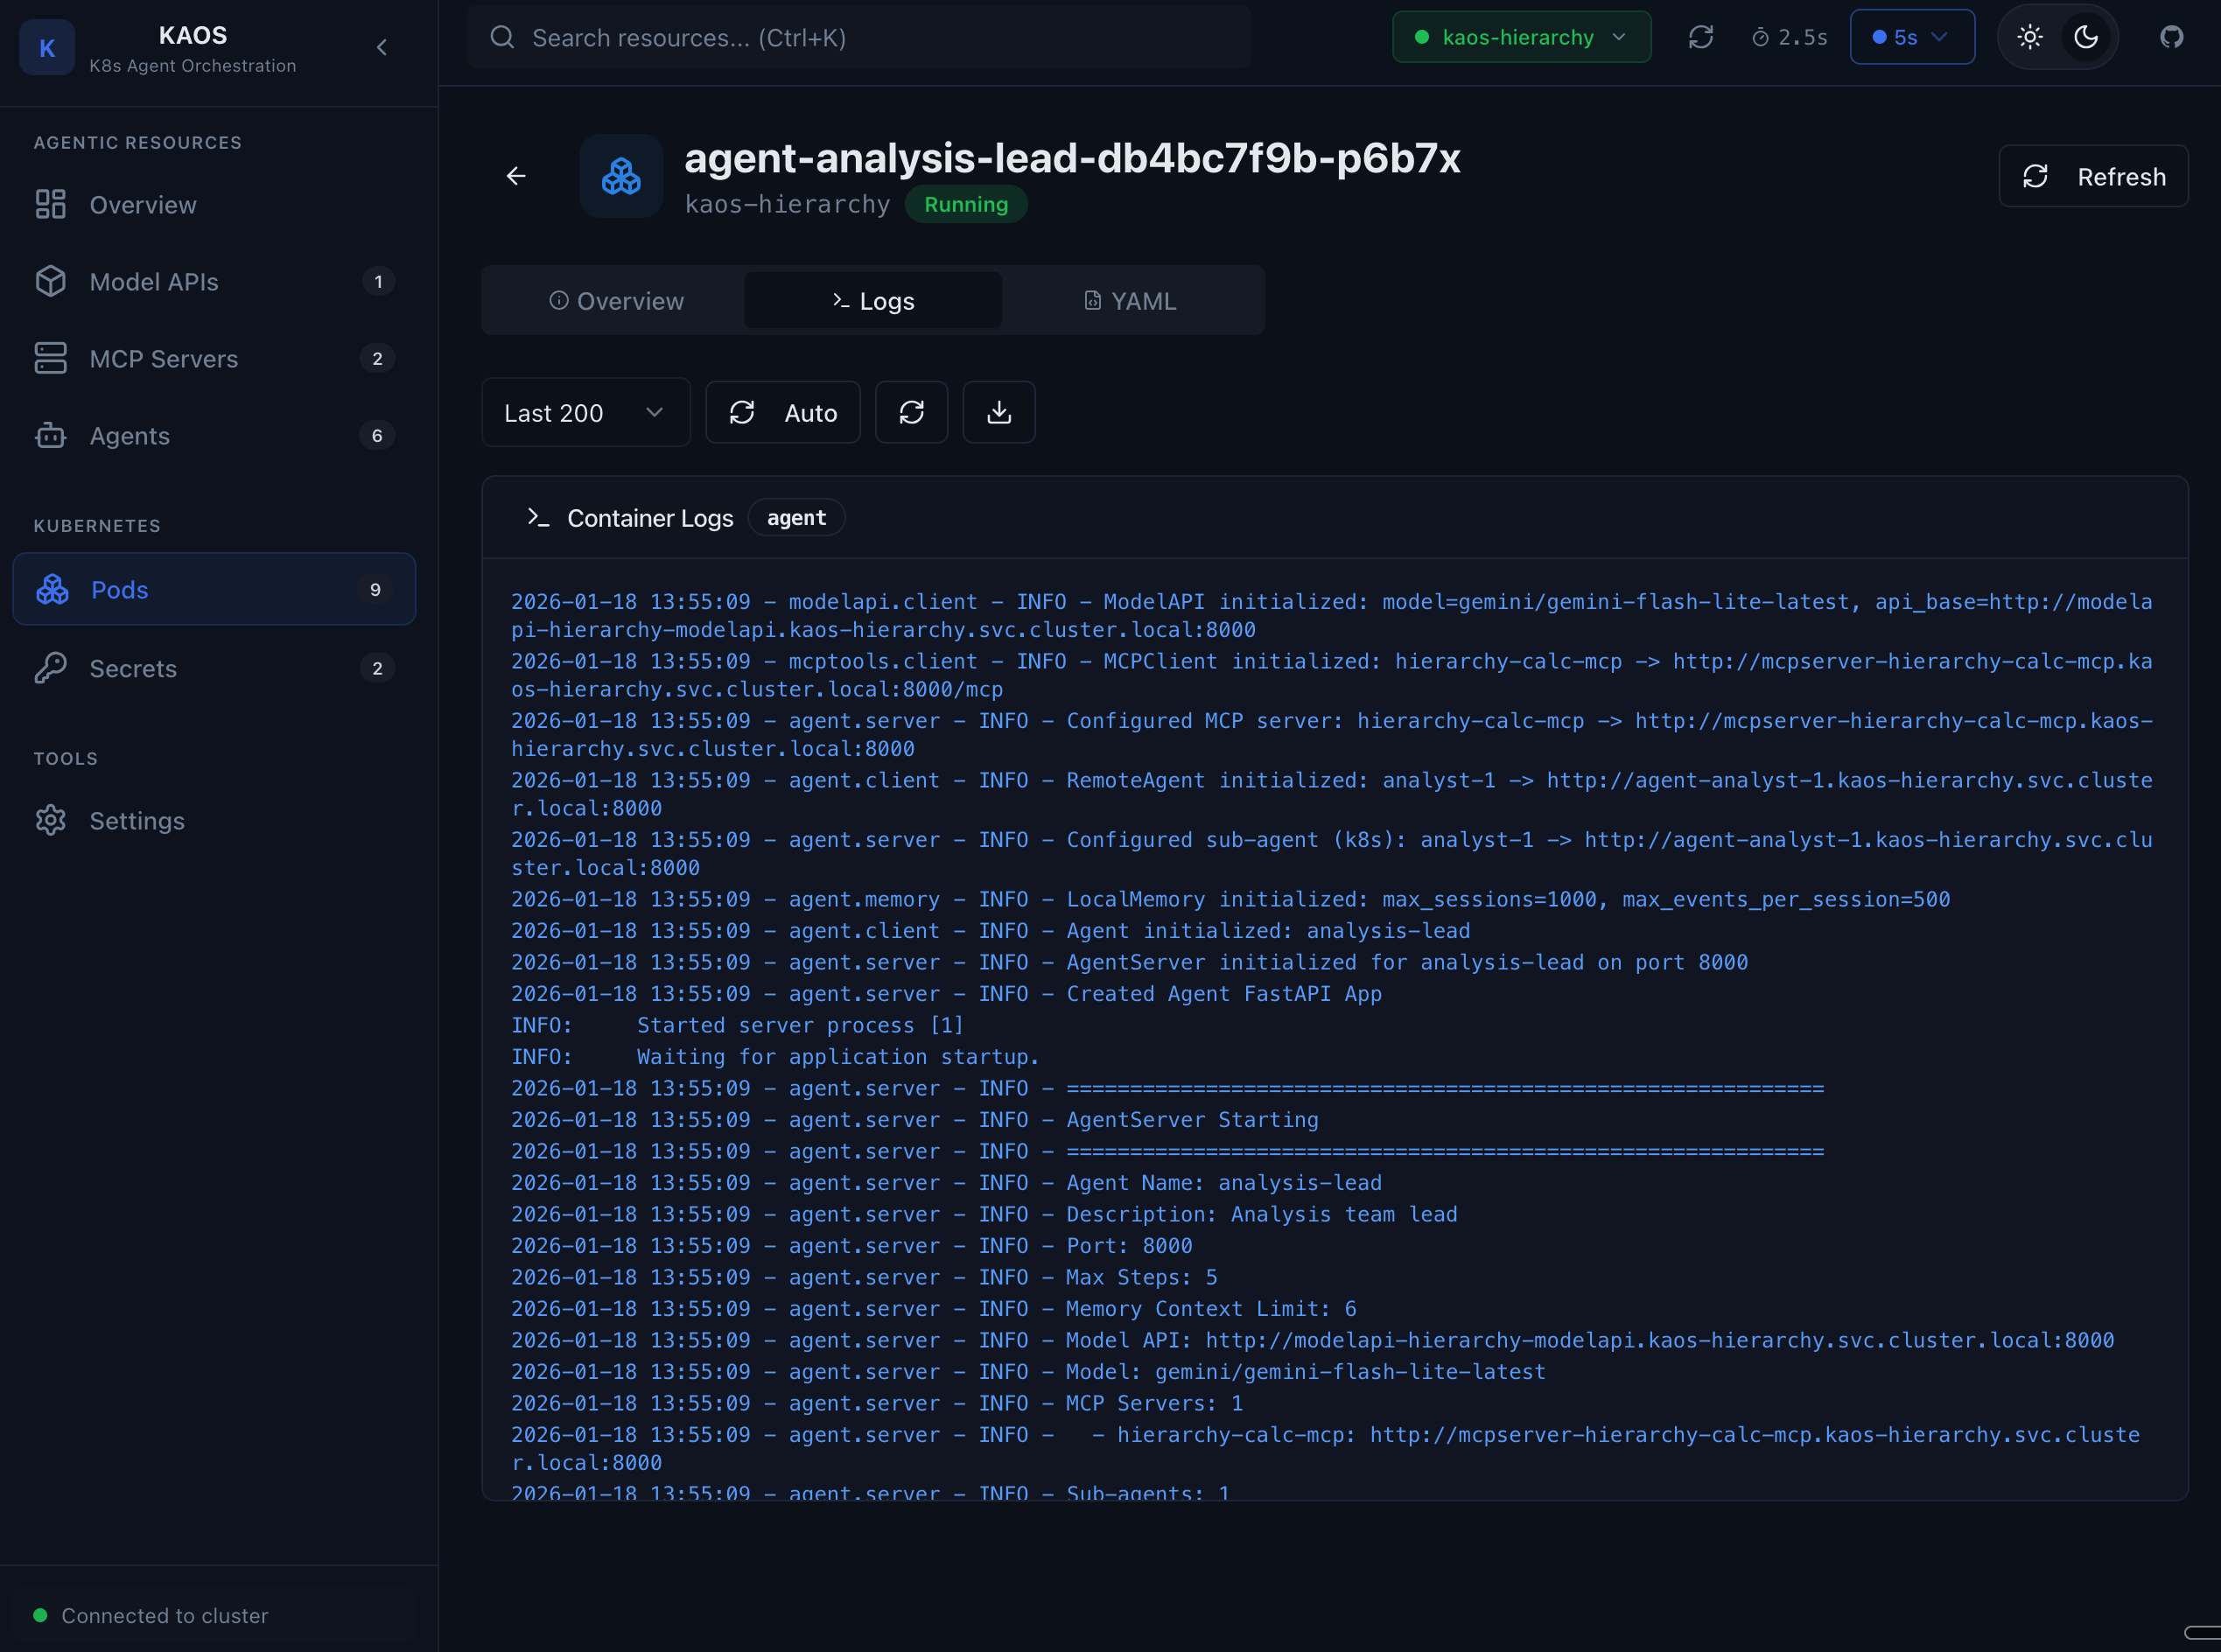
Features:
- Live log streaming
- Container selection
- Log level filtering
- Download logs
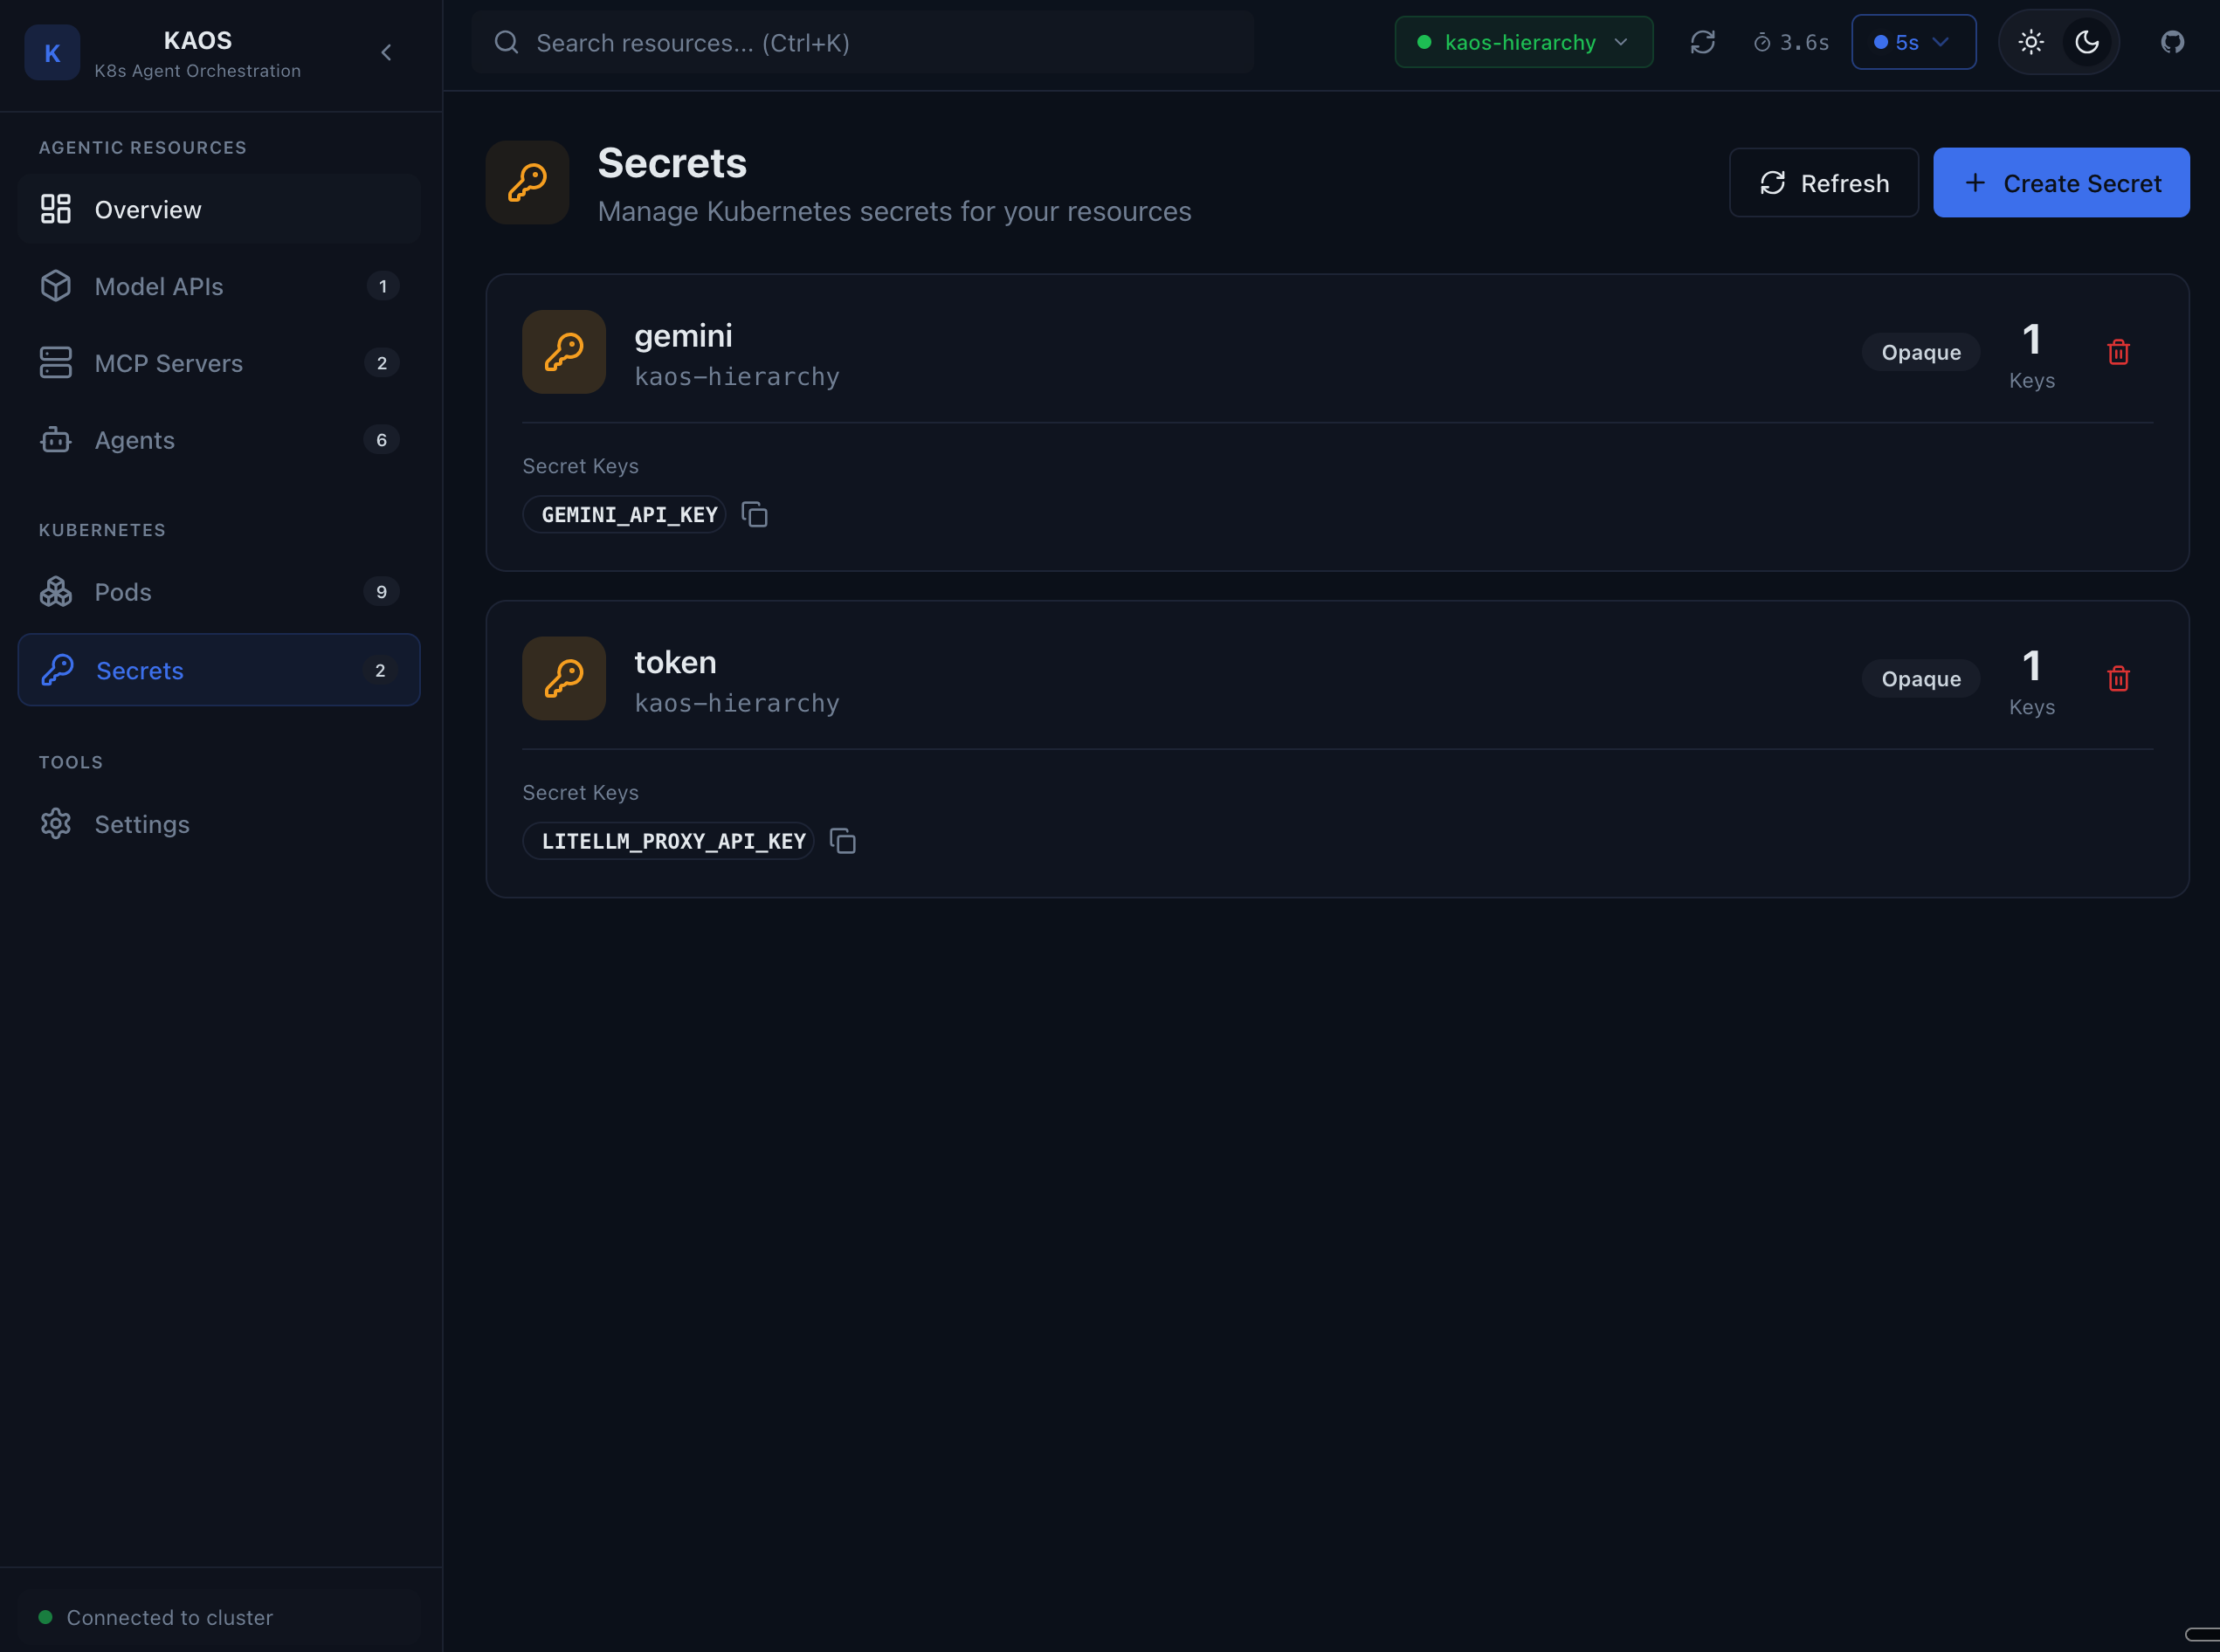
Secrets
Secret List
View secrets in your namespace (values are hidden).
Settings
Connectivity
Configure your connection to the Kubernetes cluster.
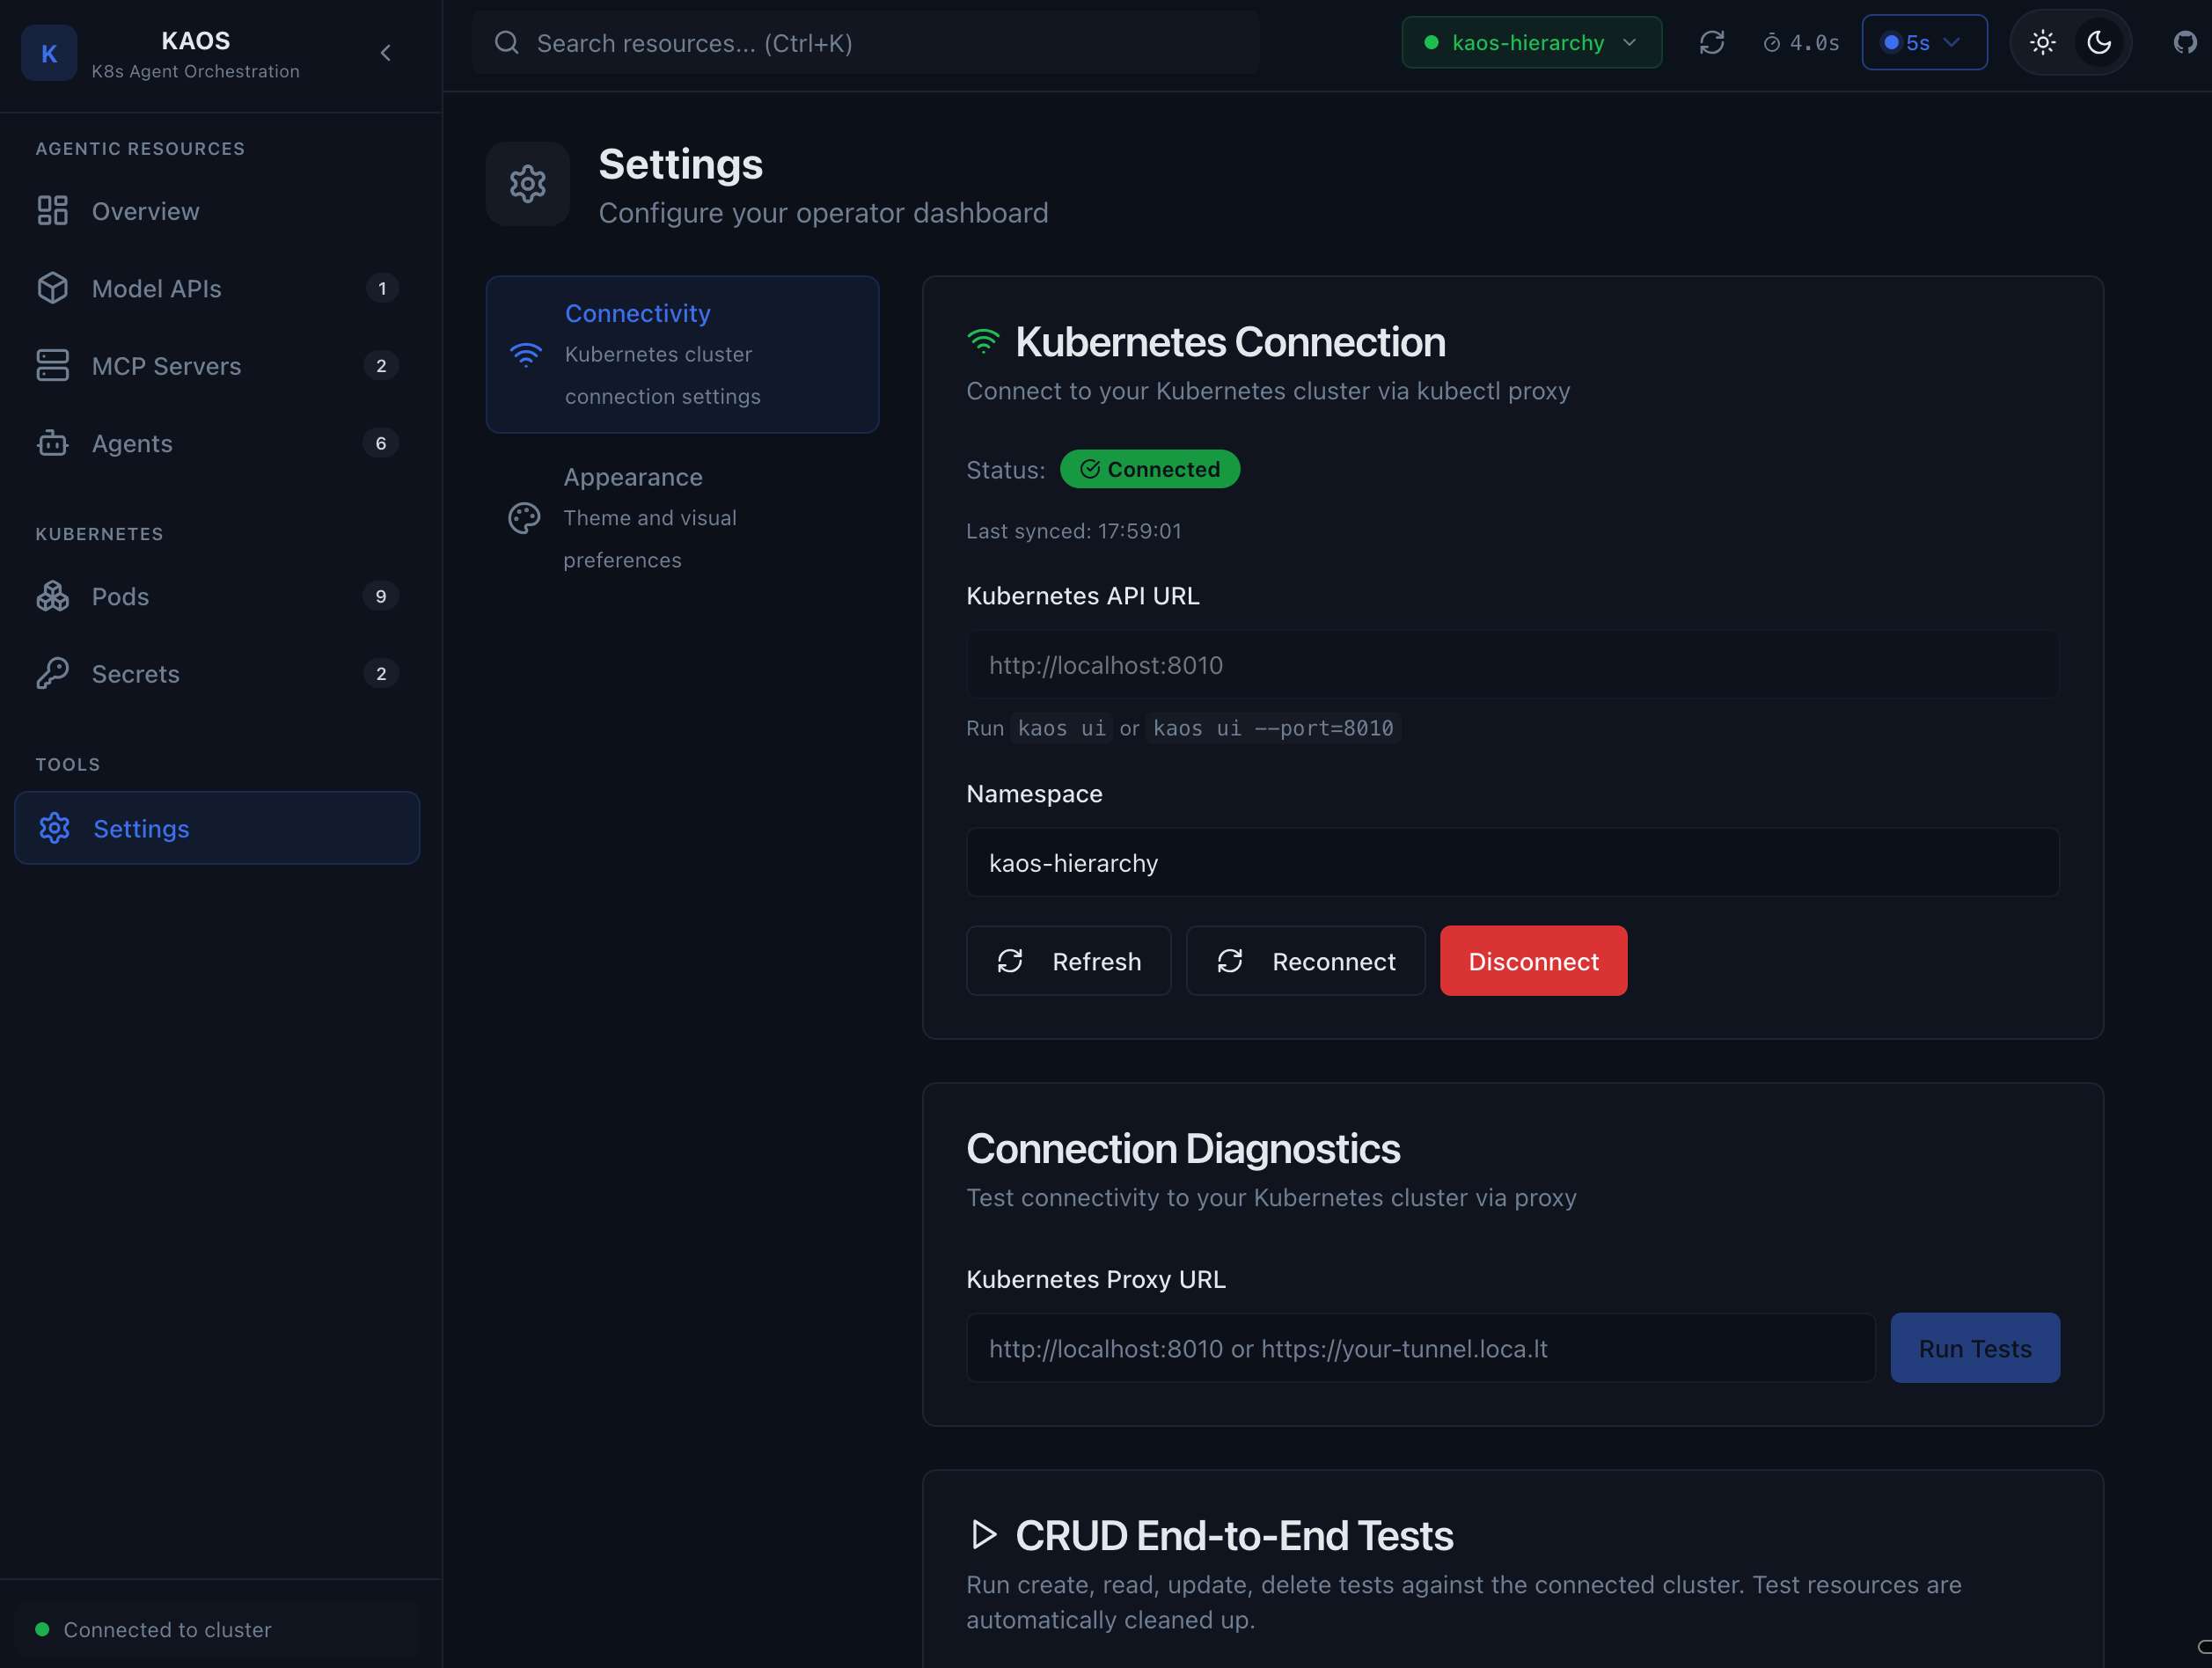
Settings include:
- Proxy URL - The local CORS proxy address (default:
http://localhost:8080) - Namespace - The Kubernetes namespace to manage
- Connection test - Verify connectivity
Keyboard Shortcuts
| Shortcut | Action |
|---|---|
/ | Focus search |
Esc | Close modal |
Ctrl+Enter | Send chat message |
Tips
- Use the chat feature to test agents before exposing them to users
- Check memory when debugging unexpected agent behavior
- Use tool debug to verify MCP servers are working correctly
- Watch pod logs for real-time debugging